[Crawl-Date: 2026-04-27]
[Source: DataJelly Visibility Layer]
[URL: https://datajelly.com/blog/content-disappears-after-deploy-dom-drop]
---
title: When Your Content Disappears After Deploy (DOM Drop Explained) | DataJelly
description: Status 200, CDN healthy, logs clean — and your HTML dropped from 142KB to 11KB overnight. The four DOM-drop patterns we see in production and how Guard catches them before traffic drops.
url: https://datajelly.com/blog/content-disappears-after-deploy-dom-drop
canonical: https://datajelly.com/blog/content-disappears-after-deploy-dom-drop
og_title: DataJelly - The Visibility Layer for Modern Apps
og_description: Rich social previews for Slack & Twitter. AI-readable content for ChatGPT & Perplexity. Zero-code setup.
og_image: https://datajelly.com/datajelly-og-image.png
twitter_card: summary_large_image
twitter_image: https://datajelly.com/datajelly-og-image.png
---
# When Your Content Disappears After Deploy (DOM Drop Explained) | DataJelly
> Status 200, CDN healthy, logs clean — and your HTML dropped from 142KB to 11KB overnight. The four DOM-drop patterns we see in production and how Guard catches them before traffic drops.
---
## The Real Failure
We see this every week. A deploy ships. Nothing crashes. Every status check is green. And the page is effectively empty for the next 8–24 hours until someone notices analytics dropping.
A real failing site we audited:
- • Status: **200 OK** on every URL
- • HTML size: **142 KB → 11 KB** (-92%)
- • Visible text: **2,800 words → <120 chars**
- • DOM nodes: **~1,400 → 8**
- • Uptime monitor: **100% green**
- • Time to detection: **~18 hours**. Organic traffic: -38%.
## What's Actually Happening
Modern SPAs don't ship content. They ship a shell. The server returns minimal HTML — a root div, a few script tags, no real text. JavaScript then fetches data, builds the DOM, and renders content. If anything in that chain fails, the page never fills in.
You still get a 200, valid HTML, and zero backend errors. But the page is empty.
This is what Googlebot, GPTBot, and most AI crawlers actually see when render fails:
Acme — Pricing
The browser, after hydration, shows a full UI. Raw HTML — what bots and AI crawlers consume — has near-zero text. This is the same failure shape covered in [Your Site Loads — But Google Sees Nothing](https://datajelly.com/blog/site-loads-google-sees-nothing) and [Script Shell Pages](https://datajelly.com/blog/script-shell-pages) .
## Concrete Signals You Can Measure
This isn't subjective. Set thresholds, measure on every deploy, alert on drift.
HTML size
**Healthy:** 50–200 KB per content page.
**Broken:** <15 KB, or a >40% drop vs last deploy.
Visible text length
**Healthy:** 1,000+ characters.
**Suspect:** <500. **Broken:** <200.
Word count
**Healthy:** 300+ for content pages.
**Broken:** <50 — almost always a render failure.
Critical elements
**Required:** title, H1, key sections (pricing, hero, content).
**Missing any:** page is functionally dead.
## Why Tools Miss This
Most monitoring is blind to this. Uptime checks, status codes, API health — all pass. Frontend monitoring (RUM) misses it because it runs *after* hydration, sees cached or partially working UI, and depends on real users hitting the page after the failure has already shipped.
- 100% uptime
- Sub-200ms TTFB
- Zero error budget burn
- Healthy synthetic checks
- 0 words of visible content shipped to bots
This isn't a system failure. It's a page output failure. See [Your Site Returns 200 OK — But Is Completely Broken](https://datajelly.com/blog/site-returns-200-but-broken) for the broader pattern.
## What We See in Production
Four DOM-drop patterns. Not edge cases — these break in production constantly across React, Vite, and Lovable apps.
1
## API regression wipes content
**Cause:** A deploy changes API shape. Frontend expects `products[]`; API now returns `items[]`. Response is still 200.
**Symptom:** Components render nothing or fall into empty-state branches. DOM never fills. HTML stays ~10KB.
**Impact:** Traffic drops within hours. Indexed pages start dropping over the next 1–2 weeks. See [Why Your Site Randomly Breaks After Deploy](https://datajelly.com/blog/site-breaks-after-deploy-silent) .
2
### Feature flag disables core sections
**Cause:** A flag defaults to `false` in production by accident, or a rollout config targets the wrong environment.
**Symptom:** Pricing section gone. Hero CTA missing. Visible text drops 60%+. No errors thrown — the code path is just skipped.
**Impact:** Rankings degrade for the missing keywords. Conversions drop on pages that lost their CTA.
3
### JS bundle fails to load
**Cause:** `main.js` 404s. CDN misconfigured. Chunk hash mismatch after a partial deploy.
**Symptom:** App never hydrates. DOM stays at the shell. `resource_error_count` spikes if you measure it.
**Impact:** 100% of pages broken for everyone hitting the bad CDN edge. Often regional. Covered in detail in [Critical JavaScript Failures](https://datajelly.com/blog/critical-js-failures) .
4
### Partial hydration after a runtime exception
**Cause:** One component throws during render — usually due to bad data, missing prop, or a dependency upgrade. React unmounts the subtree.
**Symptom:** Half the page renders, the rest is empty. Console shows the error, but no monitor fires.
**Impact:** Slower decay than full bundle failure but harder to spot. See [Hydration Crashes: The Silent Killer](https://datajelly.com/blog/hydration-crashes-silent-killer) .
## Run These Tests Now
Don't take our word for it. Check your own site in under a minute — especially after your most recent deploy.
## Quick Test: What Do Bots Actually See?
~30 seconds
Most people guess. Don't.
Run this test and look at the actual response your site returns to bots.
1
### Fetch your page as Googlebot
Use your terminal:
`curl -A "Googlebot" https://yourdomain.com`
Look for:
- Real visible text (not just ``)
- Meaningful content in the HTML
- Page size (should not be tiny)
2
### Compare bot vs browser
Now test what a real browser gets:
`curl -A "Mozilla/5.0" https://yourdomain.com`
If these responses are different, Google is indexing a different page than your users see.
Stop guessing — measure it.
### Real example: 253 words vs 13,547
We see this constantly. Here's a real example from production: Googlebot saw 253 words and 2 KB of HTML. A browser saw 13,547 words and 77.5 KB. Same URL — completely different content.
[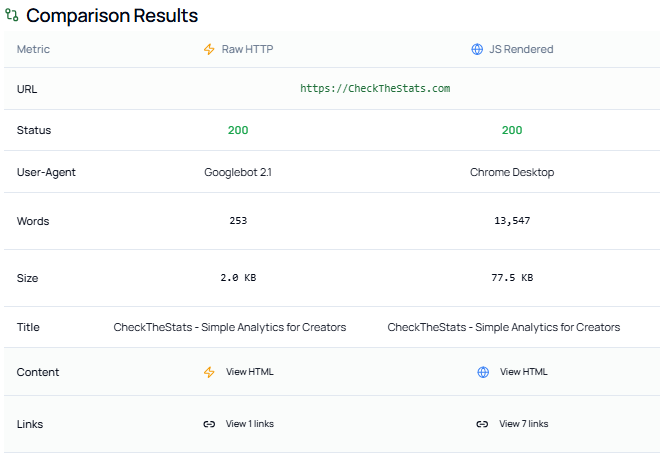 ](https://datajelly.com/assets/bot-comparison-proof-BSBvKXDf.png)
If your HTML doesn't contain the content, Google doesn't either.
[Compare Googlebot vs browser on your site → HTTP Debug Tool](https://datajelly.com/seo-tools/http-debug)
3
### Check for common failure signals
We see this all the time in production:
- HTML under ~1KB → usually empty shell
- Visible text under ~200 characters → thin or missing content
- Missing
or <h1> → weak or broken page
- Large difference between bot vs browser HTML → rendering issue
### Use the DataJelly Visibility Test (Recommended)
You can run this without touching curl. It shows you:
- Raw HTML returned to bots (Googlebot, Bing, GPTBot, etc.)
- Fully rendered browser version
- Side-by-side differences in word count, HTML size, links, and content
[Run Visibility Test — Free](https://datajelly.com/#visibility-test)
### What this test tells you (no guessing)
After running this, you'll know:
- Whether your HTML is actually indexable
- Whether bots are seeing partial content
- Whether rendering is breaking in production
This is the difference between *"I think SEO is set up"* and **"I know what Google is indexing."**
If you don't understand why this happens, read: [Why Google Can't See Your SPA](https://datajelly.com/blog/why-google-cant-see-your-spa)
### If this test fails
You have three real options:
SSR
Works if you can keep it stable in production
Prerendering
Breaks with dynamic content and scale
Edge Rendering
Reflects real production output without app changes
If you do nothing, you will not rank consistently. [Learn how Edge Rendering works →](https://datajelly.com/products/edge)
This issue doesn't show up in Lighthouse. It shows up in rankings.
[Run the Test](https://datajelly.com/#visibility-test) [Ask a Question](https://datajelly.com/contact)
[Page Validator
Bot-readiness scan including HTML size, word count, and critical elements.](https://datajelly.com/seo-tools/page-validator) [HTTP Bot Comparison
Diff raw bot HTML vs browser DOM — exposes the gap directly.](https://datajelly.com/seo-tools/http-debug) [Visibility Test
Run a full bot-perspective check on your homepage.](https://datajelly.com/visibility-test)
Also useful: [Sitemap Validator](https://datajelly.com/seo-tools/sitemap-validator) to confirm your indexable URLs are intact, and [HTTP Status Checker](https://datajelly.com/seo-tools/http-status-checker) to verify pages still resolve correctly across the site.
## How to Detect It
## 1. Inspect raw HTML (without JS)
curl -s https://yoursite.com/pricing | wc -c
If the byte count is tiny (under ~15KB on a real content page), your page is broken. The browser will lie to you because it shows the rendered DOM.
## 2. Track HTML size over time
Baseline matters. A page that was 130KB yesterday and is 9KB today is not "optimized" — it's failing.
<!-- yesterday: 142 KB, ~2,800 words rendered server-side --><html> <head><title>Pricing — Acme... Pricing