Turn Client Site Monitoring Into a Retainer Line Item
Turn unpaid firefighting into recurring revenue by packaging rendered-page monitoring. Scope it, price it, sell it, and prove the value with hard evidence.
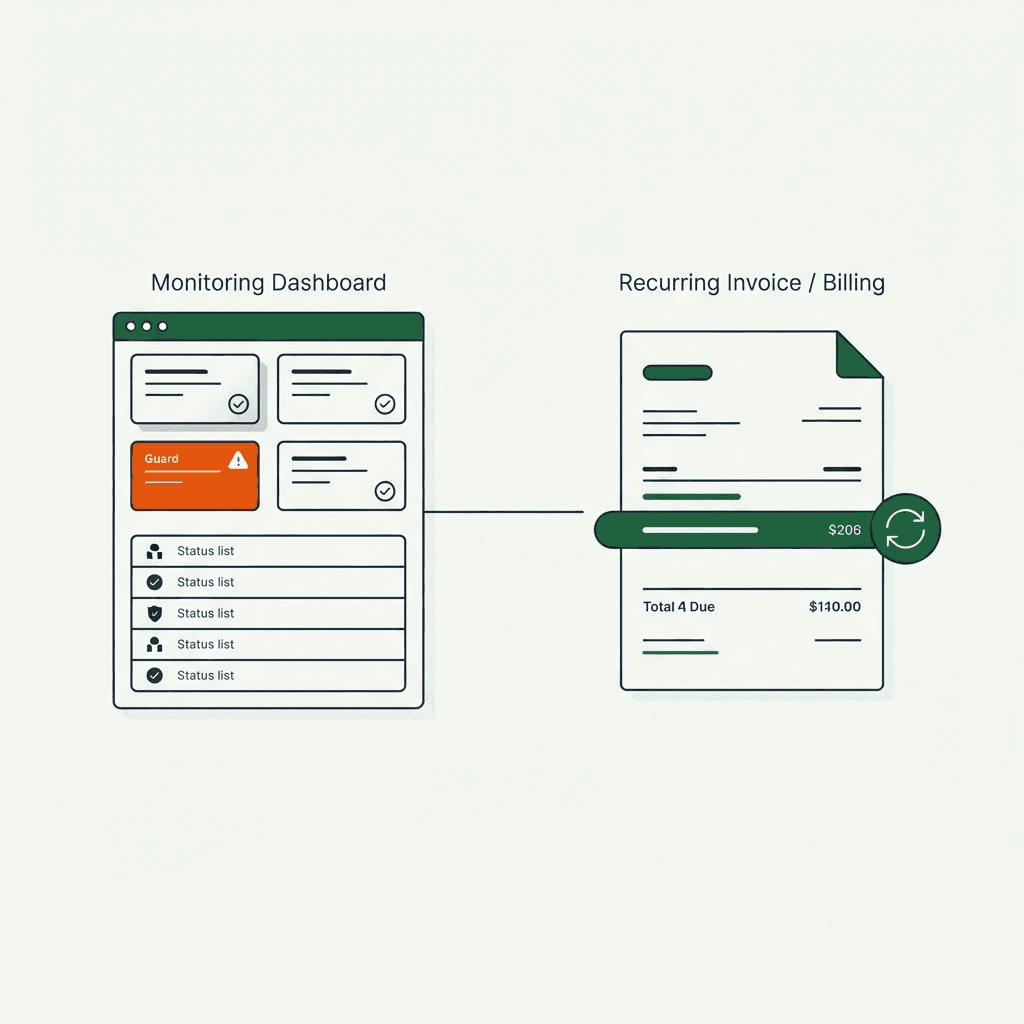
You know the pattern. A client emails at 8:12 a.m. because the homepage CTA vanished after a deploy. A product page lost prices overnight. An SEO landing page dropped out of search after a CMS change. Your team scrambles. You fix it. Nobody pays for the time. That setup trains clients to expect emergency work inside the retainer and trains your team to absorb unbilled effort. Stop treating monitoring like an informal habit. Sell it as a productized service. This article shows how to turn site monitoring into a clear retainer line item with defined deliverables, pricing, objection handling, and ROI proof.
Why agencies absorb monitoring today—and lose margin
Most agencies sell support or maintenance but leave active monitoring implied. So you learn about failures only after customers or clients complain. Two causes show up again and again. First, teams rely on uptime checks and error trackers. Those tools catch outages and JavaScript exceptions, but they miss silent rendered-page failures. Second, agencies rarely package monitoring as a named service, so the work gets billed hourly or not billed at all. The margin leak shows up in three places: unplanned work, developer context-switching, and slower detection that increases business damage. Package monitoring as a standard deliverable and the incentives change. You get paid to catch failures early. Clients get proactive protection.
What to sell: a productized site health add-on
Keep the offer simple. Add a named service to the retainer: Site Health or Page Monitoring. Make the deliverables concrete:
-
Defined page coverage. State how many pages or page types you monitor. Example: 10 pages covering the homepage, 5 high-traffic product pages, cart, checkout entry, and 3 SEO landing pages.
-
Proactive alerts. Notify the client and your ops team when a monitored page renders incorrectly or critical elements regress. Include severity levels and an acknowledgement SLA.
-
Monthly health reporting. Deliver a one-page report with incidents, screenshots, rendered HTML snapshots, and trends.
-
Faster incident response. Give monitoring clients priority triage and fixed response windows instead of a normal support queue.
Rendered-page monitoring is not uptime monitoring
Clients will ask, "Isn't the site already monitored?" Draw the line fast.
Uptime checks ping the server and look for a 200 response. They catch downtime, DNS failures, and simple outages.
Rendered-page monitoring loads the page in a browser, runs JavaScript, and captures what a user actually sees.
That difference matters. Modern sites are heavily client-rendered. A page can return 200 OK and still fail in ways that hurt revenue or SEO:
- Blank render after a deploy while the server stays up
- Add-to-cart button missing on product pages
- Price or image fields not rendered
- Structured data removed or malformed
- Unexpected redirect to the homepage
- Console errors from payment scripts
Each one has a business cost: lost sales, lost leads, or SEO damage. Screenshots, final HTML, and console logs give engineering and product teams something they can act on. That is the service. If you want to see exactly which checks this involves, the Guard test suite breakdown lists every production check from render integrity to SEO.
How to scope it: pages, frequency, coverage
Good scoping protects margin and sets expectations. Use three axes: page count, check frequency, and page priority.
Start here:
- Tier A: Critical commerce and lead pages—homepage, cart, checkout entry, top 5 product pages. Check every 5–10 minutes.
- Tier B: Important content and SEO pages—top category pages and campaign landing pages. Check every 15–30 minutes.
- Tier C: Lower-traffic pages—templates and resource pages. Check every 4–24 hours.
Rules that keep scope sane:
- Define a page as a URL pattern or template. For dynamic product pages, one profile can cover representative SKUs.
- For large catalogs, sample. Monitor 20 product pages across top sellers, low-stock items, and variants.
- Check revenue pages more often. Cart and checkout entry usually justify 5–10 minute checks.
- Define checks by page type. Example: product page must show title, price, at least one image, and an enabled add-to-cart button.
- List exclusions. Skip internal admin pages, staging, transactional emails, and long multi-step checkout flows beyond the entry point unless the contract says otherwise.
Example scope table:
- 10-page coverage: homepage, 3 product templates, 2 category pages, cart, checkout entry, contact page, pricing page. Checks every 10 minutes.
- 50-page coverage: homepage, 10 product profiles, 10 categories, 5 campaign pages, cart, checkout entry, plus 12 SEO landing pages. Checks every 15 minutes.
Explicit scope stops scope creep and ties cost to coverage.
Pricing models that clients understand
Three pricing models work well. Pick the one that matches your sales motion.
-
Flat monthly add-on per site. Simple and predictable. Example: $250/month for up to 10 pages with 10-minute checks. $500/month for up to 50 pages with 15-minute checks.
-
Tiered packages. Define page counts, frequency, and SLA. Example: Standard $300 (10 pages, 30-minute checks), Pro $700 (30 pages, 15-minute checks), Enterprise $1,500 (100 pages, 5–10-minute checks, 24/7 alerting).
-
Bundled retainer tier. Roll monitoring into a higher support tier and call out the faster SLA.
Pricing rules:
- Price against business risk, not effort. Monitoring checkout entry is worth more than monitoring a blog post.
- Price per site for smaller clients. For multi-site enterprise accounts, use volume discounts and custom SLAs.
- Charge setup in month one for discovery, sampling, and threshold tuning. Typical setup takes 1–3 hours per site.
- Offer optional on-call or remediation time. Example: 2 hours of guaranteed triage included, then hourly.
Sell the outcome. Clients are buying revenue protection and faster detection.
Starter pricing matrix:
- Basic: $200/mo — 10 pages, 30-minute checks, monthly report
- Growth: $600/mo — 30 pages, 15-minute checks, monthly report, 4-hour acknowledgement SLA
- Commerce: $1,200/mo — 50 pages including cart and checkout entry, 5–10 minute checks, 2-hour SLA, weekly executive summary
Your site returns 200 OK — but is it actually working?
Guard is the monitoring technology that catches the silent failures other tools miss. KeyPages.ai is where you turn it on. Audit any URL free first — no signup, results in 30 seconds.
Run a free page auditHow to position the value and handle objections
Keep the pitch short. Back it with evidence.
Three value props work:
- Catch failures before customers do.
- Protect revenue and leads by watching carts, checkouts, prices, and CTAs.
- Cut recovery time with priority triage.
Common objections:
-
"Isn't it already monitored?" Answer: uptime checks watch servers. This watches what customers actually see. Demo a page that returns 200 but renders blank. Show the screenshot and console errors. A free Guard page audit on a live client URL makes this concrete in seconds.
-
"We already have Sentry/New Relic/GA alerts." Answer: good tools, different job. Error tracking catches exceptions. It does not tell you when a CTA disappears, a price field stops rendering, or a robots tag changes.
-
"We can't afford more retainer spend." Answer: use a recent incident. Estimate lost leads or sales and show how earlier detection could have cut the damage. If needed, offer a smaller bundle or lower-frequency checks.
-
"Won't false positives create noise?" Answer: tune checks for signals that matter: missing CTA, missing price, noindex added, redirect bug. Add a short human verification step for noisy alerts. Include screenshots and rendered HTML so triage is fast.
How to prove ROI with evidence and reporting
Clients buy proof, not promises. Every alert should carry evidence:
- Timestamp
- Screenshot
- Rendered HTML snapshot
- Final URL and redirects
- HTTP status
- Page metadata: title, H1, canonical, robots meta
- Visible text length
- Console errors
- Short human summary of impact
That bundle turns a vague "something broke" email into a useful ticket.
Run two workflows:
- Incident workflow: automated alert → evidence capture → ops acknowledgement → triage ticket
- Reporting workflow: compile incidents into a monthly scorecard
Monthly report components:
- Summary: incident count, severity breakdown, mean time to acknowledge, time to resolution
- Top incidents: screenshots and cause summary
- Trends: repeat regressions, third-party script failures, performance regressions
- Action items: recommended fixes and roadmap items
Use case examples to show value:
- Example A: Product page prices disappeared after a theme deploy. Monitoring alerted in 7 minutes. Engineers used the evidence to roll back the release and restore prices within 40 minutes. Estimate saved sales as average hourly revenue × 40 minutes.
- Example B: An SEO landing page picked up a noindex tag after a CMS plugin update. Monitoring caught the robots meta change before the page lost a week of traffic.
Do not promise exact savings. Show assumptions. Track prevented incidents and time saved. That is what renews the service.
Operational playbook and simple service tiers
Turn this into an operating system, not a custom favor.
Operational playbook:
- Discovery (Day 0–3): inventory critical pages, define page-type checks like title, H1, CTA, and price, and map owners.
- Baseline (Day 3–7): run frequent checks to capture normal renders and timings.
- Alert rules (Day 7): tune thresholds, set severity levels, and define SLAs.
- Live monitoring (ongoing): send alerts to Slack or email and create a ticket with evidence.
- Monthly review: deliver the report and adjust scope or frequency based on what failed.
Client-facing tiers:
- Bronze — $250/mo: up to 10 pages, 30-minute checks, email alerts, monthly report
- Silver — $600/mo: up to 30 pages, 15-minute checks, Slack and email alerts, 8-hour acknowledgement SLA, monthly report with top incidents
- Gold — $1,500/mo: up to 75 pages, 5–10 minute checks for commerce pages, 4-hour acknowledgement SLA, weekly summaries, 2 hours of included remediation time
- Custom — price on request: multi-site coverage, higher-frequency checks, on-call, custom dashboards
Prep checklist before you sell:
- Map revenue pages and owners
- Pick check frequency by page type
- Define checks per page: CTA, price, image, title, robots meta
- Set incident SLAs and included remediation minutes
- Prepare a sample incident report with screenshots and recommended fix
- Set pricing tiers and setup fee for 1–3 hours of discovery
Turn it into a pitch and a contract
Short pitch: "We offer Site Health monitoring as an add-on. We watch the pages that make you money, alert you when rendering or critical content changes, and send screenshots and technical evidence so your team can fix failures fast. That cuts the risk of lost leads and revenue and gives you a clear SLA for high-priority incidents."
Contract bullets:
- Scope: monitored pages or templates and check frequency
- Deliverables: automated alerts, evidence bundle per incident, monthly health report
- SLAs: acknowledgement windows and included remediation hours
- Exclusions: monitoring is not full QA for every deploy and does not run full checkout payments unless explicitly contracted
- Data retention and privacy: how long snapshots and logs are kept
- Change management: how pages get added or removed and how pricing changes
Set expectations clearly. Monitoring detects and reports failures. It does not replace QA. Remediation and engineering fixes are billed as agreed, either through included hours or hourly work.
Start with a pilot, then expand
If the client resists the price, shrink the first step. Offer a 60–90 day pilot on a small set of critical pages.
Pilot plan:
- Pick 5–10 critical pages: homepage, 2 product pages, cart, checkout entry, and one SEO landing page.
- Run 10-minute checks for 30 days.
- Send immediate alerts with evidence and deliver a 30-day report with incidents and recovery times.
- Present a basic ROI model: incidents detected × estimated revenue or lead impact.
Pilot wins make the upsell easier. Show the screenshot and console log from a failure that would have cost the client money. Evidence closes faster than theory.
Tooling: build it or buy it
You can assemble this stack yourself or buy a dedicated tool. The core requirements stay the same:
- Headless browser checks that render real pages and capture DOM, screenshots, and console evidence
- Rules to verify page elements and metadata
- Alerting and ticketing integrations like Slack, PagerDuty, or Zendesk
- A reporting pipeline for monthly summaries
Building gives you control, but it also gives you maintenance work: rendering reliability, bot blocking, and snapshot storage. Buying gets you to market faster and usually gives you better browser-rendered evidence out of the box.
If you evaluate vendors, require this minimum evidence set: screenshot, rendered HTML, and console or resource logs. You can browse the full Guard test catalog to see how each check maps to a severity level and a fix.
Stop running an unpaid emergency room
Treat monitoring like any other productized service. Define what you watch, how often you check it, what evidence you deliver, and what SLA you back it with. Price it against business risk. Prove it with short pilots and hard evidence.
If you build it in-house, focus on rendered-page checks and sample-based coverage for large catalogs. If you buy, pick tools that capture browser-rendered evidence: screenshot, final HTML, console errors, and metadata.
A monitoring add-on turns lost time into recurring revenue. It cuts the angry all-caps emails. It makes your agency look like a partner, not an unpaid emergency room.
DataJelly Guard is one example of a service that watches production pages, captures browser-rendered evidence like screenshots, rendered HTML, console logs, and metadata, and alerts on silent regressions. Use output like that to justify the retainer and show measurable results.
Run a 30–90 day pilot on 5–10 revenue pages. Alert on rendered-page failures, attach screenshots and HTML to every incident, estimate the revenue or lead impact, then turn that proof into a paid monitoring retainer.
Your site returns 200 OK — but is it actually working?
Guard is the monitoring technology that catches the silent failures other tools miss. KeyPages.ai is where you turn it on. Audit any URL free first — no signup, results in 30 seconds.
Run a free page audit