200 OK But Broken: Why Uptime Monitors Miss It
A modern JavaScript app can return 200 OK and still ship a blank page, broken UI, or dead-end flow. Here's exactly why uptime monitors and ping checks stay green while users see a broken page, and which rendered checks catch it.
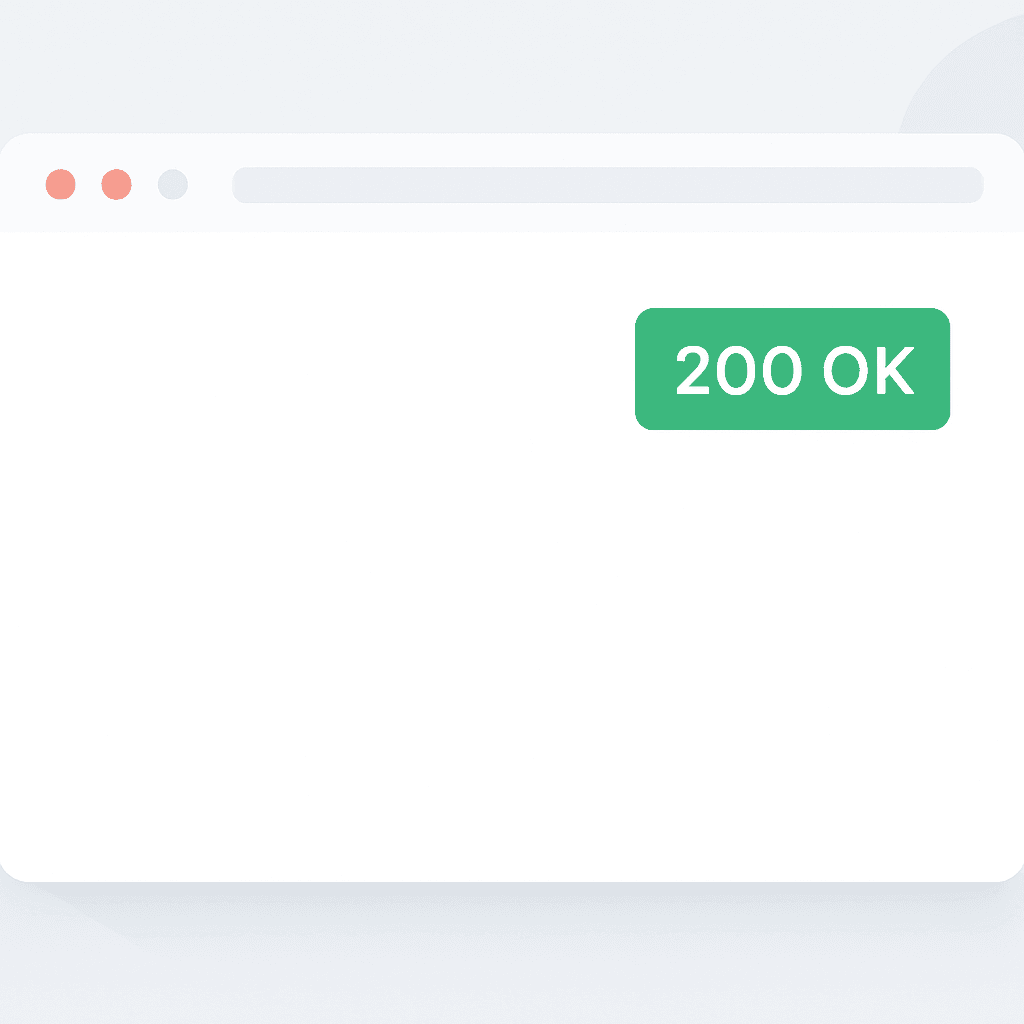
Your server returns 200 OK. Your monitor stays green. Your users get a blank page. Or a dead signup button. Or an SEO bot indexing an empty shell. Modern JavaScript apps can hide catastrophic failures behind a successful HTTP response. Here's how that happens, why uptime checks and logs miss it, and which rendered-page checks should run after every deploy.
How a 200 OK Lies in Modern Web Apps
HTTP 200 means the server sent a response. It does not mean the page rendered usable content. On classic server-rendered sites, a 200 usually included the HTML users needed. Modern apps move the real work to the browser. The server sends a shell. JavaScript downloads. Then the app hydrates or builds the UI. If any step fails after the first response, the HTTP layer still looks healthy.
Common failure points after 200 OK:
- Missing or broken JavaScript bundles (404/500 for static assets or corrupted uploads).
- Runtime JavaScript errors that abort rendering (syntax errors, null dereferences, failed async initialization).
- Third-party script failures (analytics, A/B testing, auth widgets) that block critical flows.
- Client-side routing mismatches that show an empty shell on certain paths.
- Feature flag flaps where the server serves a shell expecting a client flag to render content.
Concrete example: you deploy a build where the bundler changes module IDs. Your CDN still serves an old vendor.js for some requests. The server returns 200 with index.html. The old vendor.js calls a missing function. React dies before render. Result: blank page, HTTP 200.
Why Uptime Checks and Logs Often Don't Help
Traditional uptime checks do one thing: hit /health or /, expect 200, and measure latency. Great for dead servers. Useless for client-side render failures.
Logs sound like a safety net. Usually they aren't. Most logs describe backend activity, not whether the UI ever became usable.
Why logs miss broken UI:
- Server logs stop at the response. They don't capture client runtime exceptions unless client-side error reporting exists and still works.
- The backend can succeed while the frontend fails. Your API returns data. Your client expects a field that no longer exists. The UI crashes anyway.
- Sampling hides the blast radius. Error trackers throttle or sample. A failure that hits a small slice of traffic can disappear into noise.
Example: a small fraction of bundles are corrupted because of an edge CDN misconfiguration. Backend uptime stays at 100%. Server logs show nothing. But that same fraction of sessions get a blank page. At 200,000 daily visitors, even 0.5% is 1,000 broken sessions a day.
Common Real-World Failure Modes
- Asset 404/500 after deploy
- Cause: incomplete invalidation, a bad asset manifest, or a typo in the path.
- Symptom: index.html loads, but main.js never does.
- How to detect: a rendered check that waits for a known DOM element.
- Runtime exception on boot
- Cause: new code assumes a browser API or data shape; null.access crashes.
- Symptom: blank screen, uncaught exception in the console.
- How to detect: a headless browser test that asserts zero JS errors and checks for key elements.
- Critical third-party SDK blocking
- Cause: a payment or auth widget blocks the event loop or throws.
- Symptom: signup stalls; button clicks do nothing.
- How to detect: a synthetic transaction test that runs the signup flow and checks for success.
- Feature flags and config mismatch
- Cause: the backend exposes flags; the client expects a different flag structure.
- Symptom: the UI hides entire sections or gets stuck in a gated state.
- How to detect: after-deploy rendered checks that exercise paths under different flag permutations.
- SEO content missing due to client-only rendering
- Cause: the SPA renders content client-side, and the search bot sees only the shell.
- Symptom: SEO pages return 200 but contain little crawlable content.
- How to detect: server-side or headless render checks that capture final HTML after hydration. (See how to test what Google actually sees for a step-by-step approach.)
Your site returns 200 OK — but is it actually working?
Guard is the monitoring technology that catches the silent failures other tools miss. KeyPages.ai is where you turn it on. Audit any URL free first — no signup, results in 30 seconds.
Run a free page auditRendered Page Checks: What They Are and Why They Matter
Rendered page checks are synthetic tests that load a page in a browser, wait for rendering, then assert against the final DOM and reported JS errors. They test what users see. Not just what the network returned.
What to check:
- Presence of key DOM elements. Example:
document.querySelector('#app .product-list')exists and has child nodes. - No JS runtime errors. Capture console.error and window.onerror during navigation.
- Visual snapshots or pixel diffs of critical pages.
- Critical flows succeed. Example: fill the signup form, click submit, assert redirect to /welcome or API 201.
- Response time for first meaningful paint and time-to-interactive thresholds.
Example using Playwright (Node.js) to assert no runtime errors and presence of an element:
const { chromium } = require('playwright');
(async () => {
  const browser = await chromium.launch();
  const page = await browser.newPage();
  const errors = [];
  page.on('pageerror', e => errors.push(e.message));
  await page.goto('https://example.com/', { waitUntil: 'networkidle' });
  const exists = await page.$('#main-content');
  if (!exists || errors.length) {
    console.error('Rendered-check failed', { exists: !!exists, errors });
    process.exit(1);
  }
  await browser.close();
})();
Run this after deploy. If it fails, block the release or trigger a rollback. That tests the user experience, not just TCP and HTTP. (If you'd rather not stand up and babysit a Playwright suite, DataJelly Guard runs this exact class of rendered check against your live pages — audit any URL for free to see it in action.)
Where to Insert Rendered Checks in Your Pipeline
Run rendered checks in more than one place. Different stages catch different failures.
- Pre-deploy smoke stage
- Run quick rendered checks against the candidate build in an ephemeral environment.
- Catch obvious bundling and build regressions.
- Post-deploy to canary
- Deploy to a small slice of users or a canary host.
- Run full rendered checks, including interactive flows and third-party dependencies.
- Post-deploy to production
- Run synthetic checks from multiple regions.
- Check both U.S. and international CDNs. Asset distribution drifts.
- Continuous monitoring
- Run rendered checks on a schedule.
- Compare snapshots to catch silent drift.
Timing and acceptance criteria:
- Don't just check presence. Check timing. Example: first meaningful paint < 2s for critical pages.
- Fail fast for missing UI and severe runtime errors. Treat minor visual diffs as warnings and investigate.
Example pipeline step: after your CD job completes, run a Playwright suite against the new deployment endpoint. If any test fails, fail the pipeline. That stops a 200-but-broken release before users find it for you.
Performance and Data for Prioritization
Rendered checks produce metrics worth tracking: first contentful paint, time to interactive, JS error rate, and critical transaction success. Use them to decide what to fix first.
Example metrics to track:
- Render success rate: percent of synthetic checks that fully render and pass assertions.
- JS error rate: uncaught errors per 1,000 synthetic navigations.
- Critical flow completion rate: percent of signup attempts in synthetic tests that complete.
Concrete thresholds you might use:
- Render success rate < 99.9% triggers an immediate alert.
- JS errors > 5 per 1,000 navigations triggers degraded status.
- Critical flow completion < 99% triggers rollback investigation.
The exact thresholds depend on your traffic and tolerance. The point is simple: measure the user-visible outcome, not just server uptime.
Practical Hardening Steps You Can Implement Today
- Add headless browser synthetic checks
- Use Playwright, Puppeteer, or Selenium.
- Assert DOM structure, zero page errors, and basic flows.
- Capture client-side errors reliably
- Integrate Sentry, Rollbar, or a lightweight window.onerror collector.
- Make sure error uploads survive deploys. Don't let a third-party dependency break the reporting path.
- Validate asset integrity
- Use Subresource Integrity (SRI) where possible for CDNs.
- Automate manifest validation and CDN purging in your deploy process.
- Canary deploy critical front-end changes
- Route a small percentage of real traffic to the new build.
- Run synthetic tests and watch real-user metrics.
- Automate rollback based on rendered checks
- If post-deploy rendered tests fail, make your deploy system revert to the previous build.
- Capture visual diffs for critical pages
- DOM checks catch plenty. Pixel diffs catch CSS regressions that hide content.
Example quick test for signup flow (Playwright pseudocode):
await page.goto('/signup');
await page.fill('input[name=email]', 'test@example.com');
await page.fill('input[name=password]', 'Password1!');
await page.click('button[type=submit]');
await page.waitForSelector('#welcome', { timeout: 5000 });
If this fails, the site is broken, even if / still returns 200.
Final Notes: Metrics, Deploy Safety, and Monitoring
A green uptime check does not mean your site works. Modern JavaScript apps move critical failure modes into the browser. That makes rendered-page checks mandatory.
Start small. Add a few synthetic checks for your highest-value pages. Then cover edge cases and critical flows. Use the results to drive rollbacks and prioritize engineering work. If you wire these checks into production alerting, page people only for failures users can actually feel.
A 200 OK can still ship a dead site. Add rendered-page checks to your deploy safety net before your users become your monitoring system. Start with one synthetic test for your home page and signup flow, then expand — the full post-deploy production checklist walks through every check worth automating. If you would rather not build and maintain this yourself, DataJelly Guard runs rendered checks on your real pages after every deploy — explore how the dashboard works or audit any URL for free.
Your site returns 200 OK — but is it actually working?
Guard is the monitoring technology that catches the silent failures other tools miss. KeyPages.ai is where you turn it on. Audit any URL free first — no signup, results in 30 seconds.
Run a free page audit