Monitor Business-Critical Pages Like Production
Not all URLs matter equally. Monitor high-value pages — home, pricing, signup, docs — with production-grade checks that catch performance regressions, broken flows, and conversion risk.
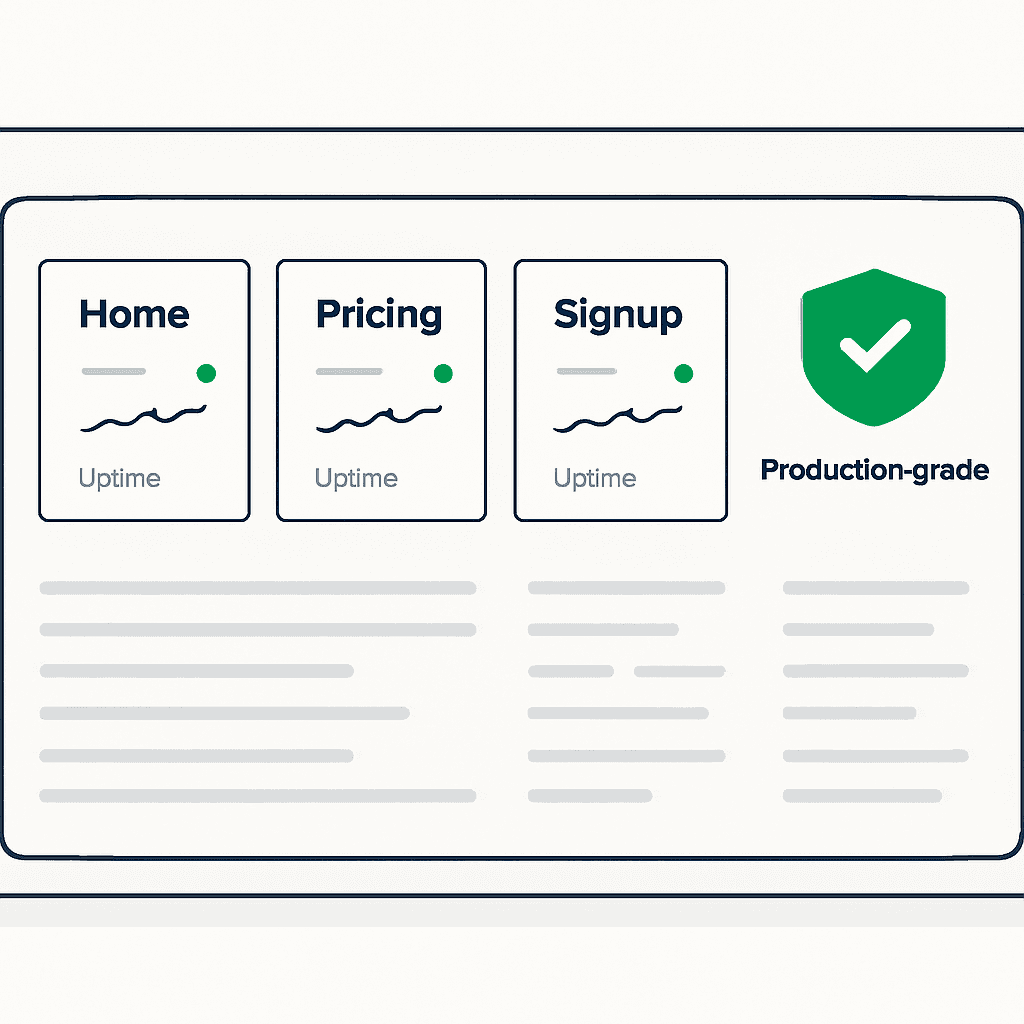
Most teams monitor the web like a server farm: check uptime, run a crawler, move on. That gives broad coverage. It misses where the business bleeds. Homepages, pricing pages, signup flows, product pages, and high-intent landing pages are not generic endpoints. They are revenue surfaces. Treat them like production systems.
Why not treat every URL the same?
Sites have thousands of URLs. A crawler that applies the same rules to every path mostly creates noise. Search result pages, duplicate content, and long-tail docs pages matter less to day-to-day business health. A pricing page that slows down or a signup step that breaks does not. Those failures cost money.
If FCP on a pricing page gets 0.5s slower, the hit can be real. Say the page gets 100k monthly visitors and converts at 2%. If worse UX drops conversion by 5%, that is 100k * 0.02 * 0.05 = 100 lost conversions. Multiply that by average LTV. Treat every page the same and you dilute alerts, bury risk, and respond too late.
What makes a page "production-grade" to monitor?
Production-grade page monitoring comes down to three things: deterministic checks, user-centric observability, and alerts you can act on.
Deterministic checks run the same request and interaction sequence every time, including redirects and authentication. That makes failures reproducible.
User-centric observability measures what users actually feel: load metrics, render times, resource waterfalls, client-side errors, and whether critical interactions succeed.
Actionable alerts fire on business impact, not random anomalies.
Concrete checklist:
- Define the journey you care about (for example: homepage → pricing → plan modal → signup start).
- Capture RRT for initial HTML, FCP, LCP, TTFB, CLS, Time to Interactive (TTI), JS exception count, resource 4xx/5xx, and business events (CTA click success, form submit response).
- Run checks from multiple geographies. Latency can differ by more than 200ms between US-East, EU-West, and AP-South. That changes LCP.
- Use a real browser agent, not a headless HTML fetch, for pages with heavy client-side rendering.
How this differs from crawling and auditing
Crawlers discover links, find broken pages, and map content structure. Great for SEO coverage. Bad at simulating user interactions that depend on JavaScript.
Audits like Lighthouse assess performance, accessibility, and best practices. Useful, but diagnostic. They tell you how to improve a page. They do not tell you whether a deploy broke a critical flow in production. (Guard tracks Lighthouse scores over time so you can spot regressions instead of one-off snapshots.)
Generic uptime checks hit /health or fetch HTML status. They will not catch a frontend regression that stops a modal from opening, breaks a third-party script, or makes the signup button unclickable.
Production-grade page monitoring does more:
- It runs synthetic user journeys in a real browser.
- It checks business gates: did the cart add, did the API return the right payload, did the form submit succeed?
- It tracks metrics over time with SLAs and error budgets. Example: keep payment-page LCP below 2.5s 95% of the time. Blow the budget, open an incident.
Your site returns 200 OK — but is it actually working?
Guard is the monitoring technology that catches the silent failures other tools miss. KeyPages.ai is where you turn it on. Audit any URL free first — no signup, results in 30 seconds.
Run a free page auditWhat to monitor for each important page
Different pages fail in different ways. Monitor the signals that matter.
Homepage and marketing landing pages: LCP, FID/INP, CLS at 75th and 95th percentiles. Hero image failures (broken src or 404). Critical CTA visibility and clickability. Third-party tag impact and resource waterfall stalls.
Pricing and product pages: LCP and Time to Interactive on mobile throttle (CPU slowdown x4, network 4G). Variant correctness (A/B test mismatches). Price or plan metadata integrity — if a price fetch returns 200 with an empty body, trigger a high-priority alert.
Signup and checkout flows: End-to-end success rate (submit → backend confirmation → redirect). Track p95 latency of the checkout API. JS exceptions during critical steps. One exception that blocks confirmation can drop conversion to zero.
Docs and help pages: Search box latency and time to first result. Broken anchors. Table-of-contents rendering and client-side TOC state.
Product pages inside the app: Feature flag correctness. Instrumented feature completion events. DOM snapshots or screenshots at key steps for visual diffs.
Alerting and SLOs you can operate on
Set SLOs around user impact, not server vanity metrics:
- Availability: 99.95% success rate for the purchase flow over 30 days. That gives about 13 minutes of monthly error budget.
- Performance: pricing-page LCP below 2.5s at p95.
- Functional: 99.9% of A/B tests render the expected variant on first load.
Tier alerts by severity:
- Immediate (Sev 1): checkout flow failure rate above 5% in 5 minutes — page the on-call engineer.
- High priority: pricing-page LCP p95 exceeds threshold for 30 minutes — Slack alert to frontend owners.
- Info: a visual diff catches a single-viewport CSS regression on non-critical elements.
Deduplicate alerts by impacted page, deploy hash, and shared error message. If 80% of signup failures show the same JavaScript stack trace and start right after a deploy, group them into one incident and attach the deploy ID.
Low-cost tactics and the role of automation
You do not need a full browser check on every page every minute. Use a sane mix:
- Lightweight checks (1–5s): HTTP status, response body signature for content sanity, CDN hit/miss. Run these every minute across many pages.
- Full synthetic journeys: run every 1–5 minutes for the pages that matter most. Run lower-value landing pages hourly.
- Canary checks on feature-flag rollouts: when a feature reaches 10% of users, run its journey only for that canary cohort.
Automation tips:
- Store deterministic test data and clean up after checks so you do not pollute production. Use disposable test emails. Cancel test orders.
- Record replayable artifacts: full HAR files, screenshots, console logs, and resource waterfalls. HAR files help debug missing assets and broken requests after the fact.
- Run synthetic checks in CI as regression gates. If LCP is above 3s or the CTA is missing, fail the pipeline.
Putting this into practice
Start with the pages that drive revenue or retention. For a two-week pilot:
- Pick 5 pages: homepage, pricing, signup start, checkout payment, and product dashboard.
- Implement full synthetic journeys for those 5 with 3 geos and mobile throttling.
- Define SLOs and set up three alert levels.
Then measure the next 30 days: conversion rate, error rate, and mean time to detect (MTTD) regressions. A realistic target is cutting MTTD for critical flow failures from hours to under 10 minutes, then recovering within 30 minutes.
The ROI is usually not subtle. If average order value is $50 and your site sees 10,000 monthly purchase attempts, recovering 1% of lost conversion adds $5,000 a month.
Treat these checks as living artifacts. Pages change. Tests need to change with them. Review journeys, thresholds, and test data every sprint. Keep ownership clear.
Closing thought
Not every URL deserves equal attention. The pages tied to revenue and retention should be instrumented, measured, and alerted on like backend services. Focus on user journeys, business outcomes, and reproducible diagnostics. Synthetic checks, percentiles, and useful SLOs cut guesswork and shrink recovery time.
Map the pages that make you money. Add production-grade synthetic checks. If you want a turnkey way to run real-browser synthetic checks, capture HARs and screenshots, and tie alerts to deploys, DataJelly Guard makes it easier to treat pages like production systems. Explore the Guard dashboard to see how config, scans, and alerts fit together, or audit a page for free to try it on a live URL.
Your site returns 200 OK — but is it actually working?
Guard is the monitoring technology that catches the silent failures other tools miss. KeyPages.ai is where you turn it on. Audit any URL free first — no signup, results in 30 seconds.
Run a free page audit