Lighthouse Monitoring: How to Read Page Quality Scores Over Time
Lighthouse turns a page load into measurable signals. But a single score is not the whole truth — it is a lab measurement from a specific run under specific conditions.
DataJelly uses Lighthouse monitoring to track trends, catch regressions, and connect page quality back to Guard-monitored production pages. The most useful signal is not one number — it is the movement across a monitored page over time.
What Lighthouse measures
| Category | What it helps evaluate |
|---|---|
| Performance | How quickly useful content appears and how much main-thread work blocks the page. |
| Accessibility | Common accessibility issues that automated tests can detect. |
| Best Practices | Security, browser compatibility, and modern web hygiene checks. |
| SEO | Basic crawler and search-friendly page signals. |
For performance, Lighthouse uses metrics including First Contentful Paint, Speed Index, Largest Contentful Paint, Total Blocking Time, and Cumulative Layout Shift. In Lighthouse 10, TBT, LCP, and CLS carry especially meaningful weight.
Lab data vs field data
Both are useful. Lighthouse is lab data — it loads a page in a controlled environment. Field data comes from real users across devices and connections.
- Lab data is good for repeatable testing and catching regressions.
- Field data is good for understanding what real users experience.
- Guard uses Lighthouse trends as a practical early warning layer, not as a complete substitute for user analytics.
How DataJelly uses Lighthouse
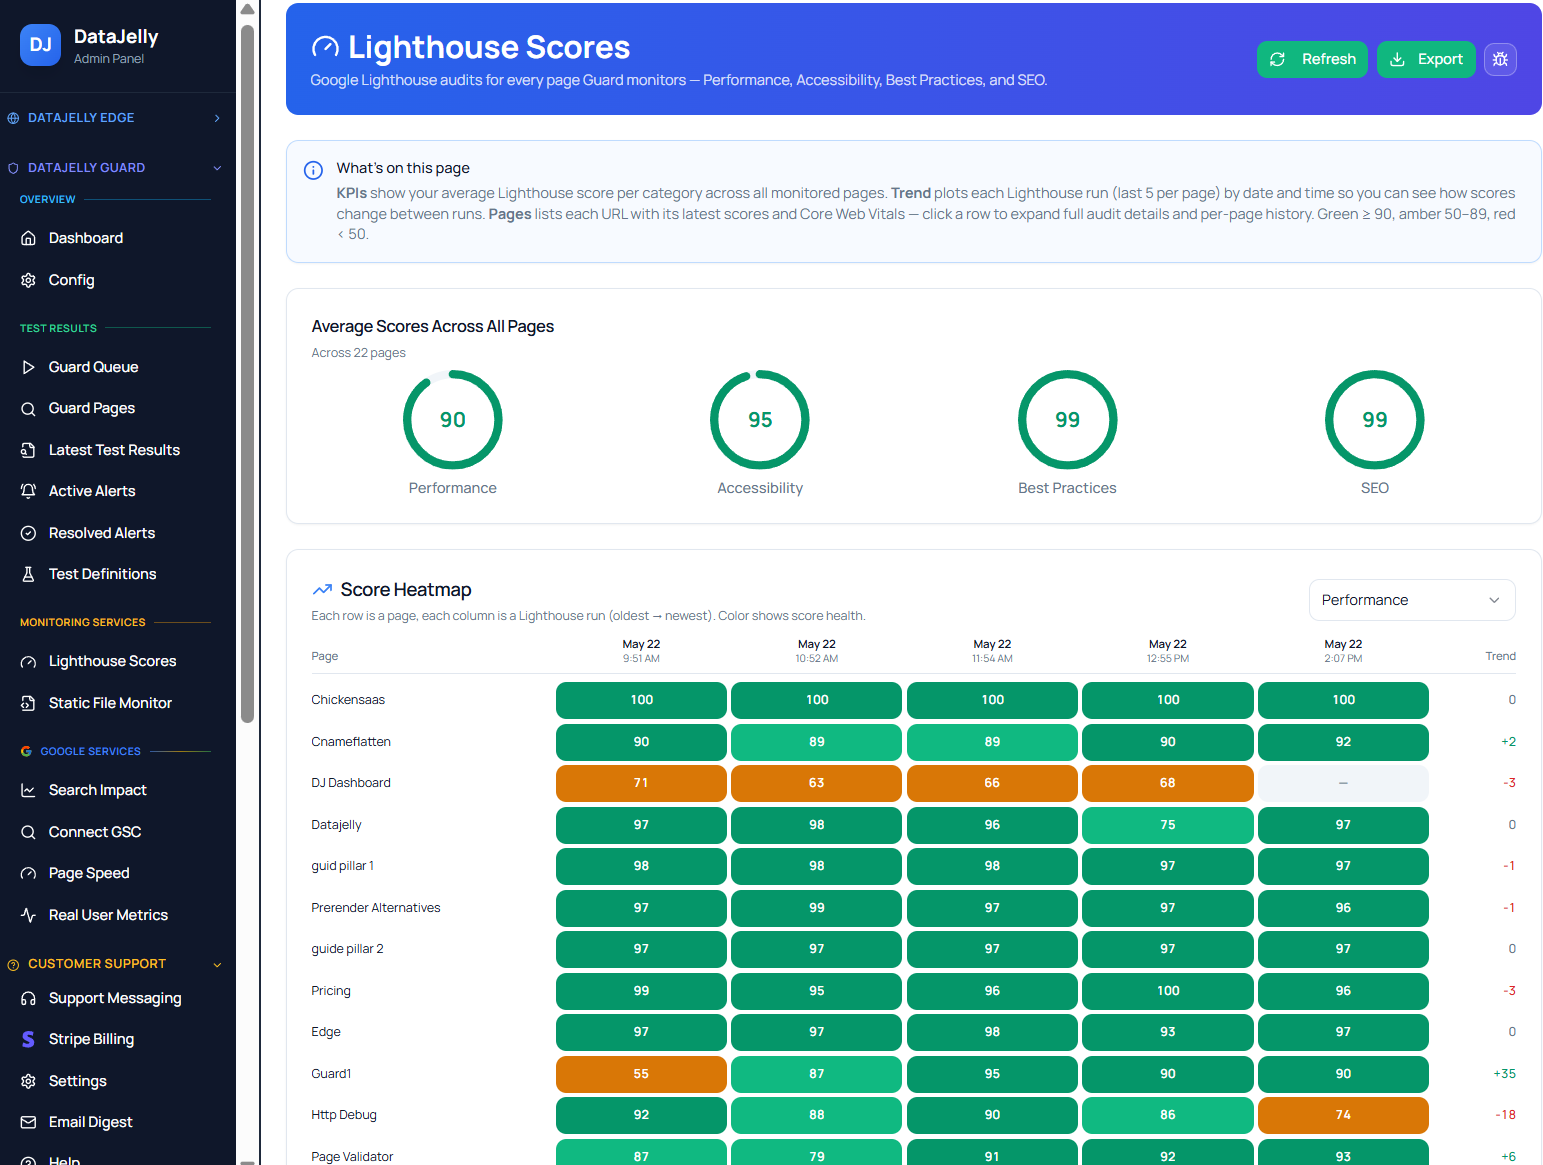
DataJelly attaches Lighthouse targets to Guard pages and runs monitored scans over time. The goal is not to shame every page with a score — it is to detect meaningful movement.
- Did this page get slower after a deploy?
- Did the SEO score change?
- Did a critical page start failing best-practice checks?
- Is one page consistently worse than the rest of the site?
- Are performance regressions happening near Guard alerts or Search Console visibility changes?
How to read score changes
A small one-off movement
A small score change may be normal noise. Lighthouse itself notes performance scores can vary because of conditions outside your code.
Action: Look for repeat movement across multiple runs before treating it as a serious regression.
A repeated downward trend
A repeated drop is more important than one bad run.
Action: Compare run history, page changes, deploy timing, third-party scripts, and resource payloads.
A sudden large drop
A large drop often points to a concrete change.
Action: Inspect detailed items: render-blocking requests, JS execution time, payload size, LCP element changes, layout shifts, or third-party behavior.
Strong Lighthouse score but Guard failure
A page can score well in Lighthouse while still failing a Guard production check such as canonical drift, text loss, or missing selectors.
Action: Treat the Guard failure as page-health evidence, not as a contradiction.
What to prioritize
Start with the pages that matter most, then focus on the problems that block users or crawlers.
Pages to start with
- High traffic
- High revenue
- Lead-generating
- Important for SEO
- Recently changed
- Failing Guard checks
- Showing Search Console declines
Problems to fix first
- Slow server response
- Large JavaScript payloads
- Render-blocking resources
- Main-thread blocking
- Layout instability
- Missing SEO metadata
- Broken crawlable links
The DataJelly angle
DataJelly Lighthouse Monitoring turns one-off audits into an operational signal.
Instead of asking what Lighthouse said when someone manually tested the homepage last month, you can ask what changed, which pages are trending down, which problems line up with alerts, and which monitored pages need developer attention first.
Track page quality where it lives
Attach Lighthouse targets to your Guard pages so quality scores sit next to rendering checks, SEO signals, and Search Console data — and you can act on trends instead of single runs.
Frequently asked questions
Should I chase a perfect Lighthouse score?
No. A perfect score is hard to achieve and often not the best use of time. Prioritize user impact, search impact, and repeated regressions.
Why did my score change if I did not deploy?
Lighthouse scores can change because of network conditions, third-party scripts, A/B tests, device differences, or other runtime conditions.
Is Lighthouse the same as Core Web Vitals?
No. Lighthouse is a lab tool. Core Web Vitals are intended to represent user experience metrics and are often evaluated with field data. Lighthouse includes some related metrics and uses Total Blocking Time as a lab proxy for interactivity.
Why does DataJelly show Lighthouse inside Guard?
Because page quality is more useful when it is tied to the pages you already monitor, the alerts you already care about, and the search data connected to those pages.
Keep reading
Guard Test Catalog
The full searchable reference of every test, with severity and how-to-fix guidance.
Guard Test Suite
How Lighthouse fits alongside availability, render, and SEO checks.
Google Search Console + Guard
Line up quality trends with real search visibility.
Static File Monitoring
Watch the crawler files behind every monitored page.
Why Pages Break After Deploy
Catch the regressions a single passing Lighthouse run can hide.