The Changes You Didn't Make: Monitoring Client Sites You Don't Control
How agencies catch silent breakage from CMS edits, plugins, tags, and third-party scripts with rendered checks, baselines, and evidence trails.
"We didn't touch it" is the line agencies hear right after a client site breaks. Sometimes it's true. It rarely helps.
The hard part isn't catching regressions from your own deploys. It's catching breakage from systems you don't control: a marketer publishing a tag in Google Tag Manager, a CMS editor changing a template, an auto-updating plugin, a third-party widget shipping new JavaScript, or a DNS change made after hours.
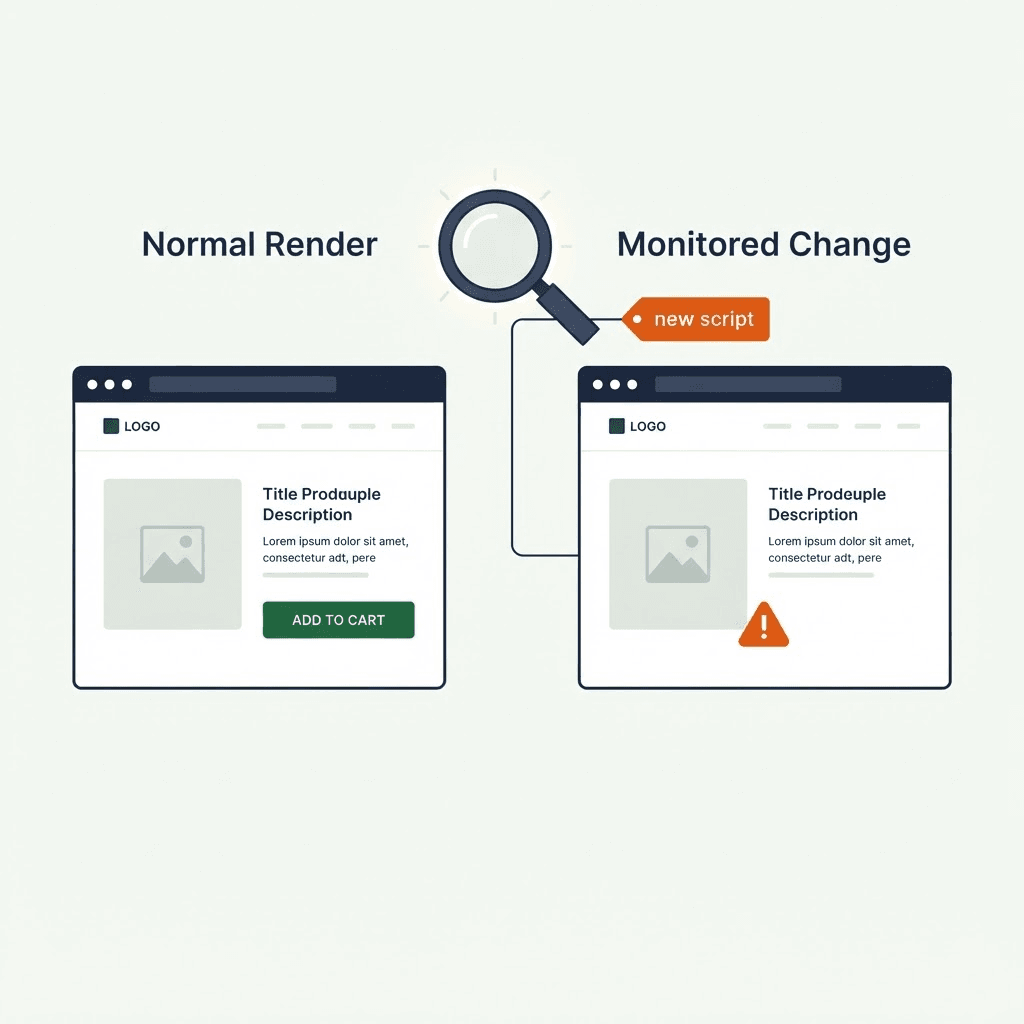
These edits can remove CTAs, break structured data, trigger console errors, or rewrite metadata while the site still returns HTTP 200 OK. This article covers where these changes come from, why uptime checks miss them, and how to catch, prove, and fix them fast. It builds on how agencies catch client site failures before clients do.
Why "We Didn't Touch It" Means Nothing
A 200 OK only tells you the server returned a response. It tells you nothing about what the browser rendered.
Modern sites push work to the client: JavaScript bundles, iframes, third-party scripts, tag managers, and consent flows. Failures usually land in two buckets:
- Client-side failures that leave the page broken despite an HTTP 200: JS crashes, missing DOM nodes, CSS that never loads.
- External changes that alter runtime behavior: a new GTM tag, a widget API change, a plugin update.
When someone edits a CMS template, publishes a marketing tag, or updates a plugin, the change often bypasses server logs. Without rendered-page checks and change detection, you learn about it when the client calls.
The Changes That Break Sites Without Touching Your Code
Common sources of breakage:
-
CMS edits and content changes
- Example: An editor swaps a product H1 template for a promo snippet. Result: product pages lose H1s and rankings drop.
-
Google Tag Manager / marketing tags
- Example: A marketer adds a third-party analytics script. Result: more scripts, race conditions, or console errors that break variant selectors or add-to-cart buttons.
-
Auto-updating plugins and apps
- Example: A social feed plugin updates itself and changes the DOM API it uses. Result: JS exceptions stop front-end initialization.
-
Theme updates
- Example: A theme update removes a custom snippet. Result: a CTA or signup form disappears sitewide.
-
Third-party widgets: chat, reviews, booking, consent
- Example: A chat vendor ships a new script with a synchronous XHR. Result: slower loads, failed resources, or blocked rendering.
-
Payment or form provider changes
- Example: A payment provider changes its embed behavior, moves elements into an iframe, or renames DOM IDs. Result: add-to-cart or checkout entry regresses.
-
DNS or hosting changes made by the client
- Example: The client points a CNAME at a caching provider with different headers. Result: content security or caching changes alter which scripts run.
None of this touches your repo. All of it changes what users see.
Why Uptime Checks Miss Browser Failures
Most monitoring stacks check HTTP status and server metrics. You need both. They're still not enough.
What they miss:
- JavaScript errors and hydration failures
- Missing DOM elements like CTAs or add-to-cart buttons
- Console errors from third-party scripts
- New external script domains or sudden jumps in script count
- Metadata changes: noindex, canonical, title rewrites
- Structured data removal or corruption
You need a synthetic browser check that renders the page and inspects the DOM. Without that rendered snapshot, you can't show what changed, when it changed, or how it broke. Then "we didn't touch it" turns into an argument. This is the same gap explored in 200 OK but broken.
Manual QA and weekly crawls are too slow. Third-party changes often roll out during peak traffic or only hit some users. Frequent rendered checks catch the damage sooner.
What to Monitor When You Don't Control the Site
Use layered checks. One signal is weak. Together they tell the story.
- Script inventory and domain detection
- Capture every script the page loads and the domains they come from.
- Alert on new domains or sudden jumps in script count.
- Console and resource errors
- Capture console logs and network failures during render.
- Prioritize uncaught exceptions and 4xx or 5xx resource failures.
- DOM and content presence checks
- Verify critical elements: H1, title, primary CTA, price, add-to-cart, search box.
- Use selectors and screenshot diffs to catch disappearances.
- Metadata and SEO signals
- Track title, meta description, canonical, robots, and structured data JSON-LD.
- Detect accidental noindex tags or canonicals that point to another domain.
- Rendered HTML and screenshot diffs
- Store before-and-after screenshots and rendered HTML.
- Use pixel diffs and DOM hashes to catch layout and content changes.
- Performance and blocking resources
- Record Largest Contentful Paint, total blocking time, and the longest request.
- Watch for third-party scripts that grab the CPU or block the main thread.
- Baseline comparison
- Keep an approved baseline for each monitored page.
- On deviation, generate a report that shows which assets, DOM nodes, or metadata changed.
This turns "something's wrong" into "the reviews widget from vendor.example.com threw two console errors and removed #subscribe at 10:23 UTC." That level of detail is exactly what Guard's test suite is built to capture.
Your site returns 200 OK — but is it actually working?
Guard is the monitoring technology that catches the silent failures other tools miss. KeyPages.ai is where you turn it on. Audit any URL free first — no signup, results in 30 seconds.
Run a free page auditFrom Silent Breakage to Proof in 15 Minutes
Scenario: A marketing manager publishes a new tracking tag in Google Tag Manager at 08:55. At 09:05, product pages lose the Add to Cart button for some users. Sales drop.
Detection workflow:
-
A rendered check at 09:00 captures the page state: screenshot, rendered HTML, script list, console logs, title, H1, and structured data.
-
At 09:05, the next check fails the add-to-cart selector assertion.
-
The monitoring system compares the 09:00 baseline to the 09:05 render and flags:
- New external script:
www.tracker-vendor.net/tt.js - Two uncaught exceptions from
tt.js #add-to-cartmissing from the DOM- Screenshot diff showing an empty CTA area
- New external script:
-
The agency sends a short incident report with the 09:00 and 09:05 screenshots, rendered HTML diff, and console logs. The evidence shows the tracker script threw a JS exception that stopped the CTA from rendering.
-
The client rolls back the GTM tag. The 09:20 check shows the CTA restored and the console clean.
That is the win. Fast diagnosis. Clear proof. No blame spiral.
A Minimal Browser Check That Produces Evidence
You do not need a full commercial stack to start. You do need a headless browser that runs JavaScript and captures rendered evidence. Puppeteer and Playwright are good starting points.
Minimal Puppeteer example to collect script domains, console errors, and a screenshot:
const puppeteer = require('puppeteer');
(async () => {
  const browser = await puppeteer.launch({ args: ['--no-sandbox'] });
  const page = await browser.newPage();
  const consoleMessages = [];
  page.on('console', msg => consoleMessages.push({type: msg.type(), text: msg.text()}));
  await page.goto('https://client.example.com/product/abc', { waitUntil: 'networkidle2', timeout: 30000 });
  const scripts = await page.evaluate(() => Array.from(document.scripts).map(s => s.src || '(inline)'));
  const html = await page.content();
  await page.screenshot({ path: 'render.png', fullPage: true });
  console.log('scripts:', scripts);
  console.log('console:', consoleMessages);
  // store html, screenshot, and scripts to your evidence store
  await browser.close();
})();
This is enough to start. Add selector assertions with document.querySelector, extract JSON-LD, compute DOM hashes, and store metadata. Run it on a schedule. Poll critical pages often.
Baseline, Triage, and Client Response
Detection without process creates noise. Use a simple workflow.
- Baseline creation
- For each important page, capture an approved baseline: screenshot, rendered HTML, script inventory, console snapshot, and required selectors.
- Store the baseline with a version, timestamp, and approver.
- Continuous checks
- Run rendered checks at a frequency that matches page importance: minute-level for checkout, hourly for landing pages, daily for static pages.
- Alerting and prioritization
- Classify alerts by severity: high for missing checkout CTAs or payment script errors, medium for third-party console errors, low for minor metadata changes.
- Evidence packaging
- Attach before-and-after screenshots, HTML diffs, script domain diffs, and console logs to every alert.
- Triage and communication
- If you control the code, roll back or patch.
- If the client or a vendor caused the change, send the evidence with one clear fix: remove the GTM tag, revert the plugin, contact the vendor.
- Post-incident updates
- Add the event to a change log.
- Update the baseline only after manual approval.
This replaces "someone changed something" with a timeline, a diff, and a fix.
Checklist for Monitoring Client Sites You Don't Fully Control
Use this checklist when your agency is not the only actor.
Pre-monitoring setup
- Identify critical pages: checkout entry, product pages, login, pricing, top SEO pages.
- Capture an approved baseline: screenshot, rendered HTML, script list, console snapshot, structured data.
- Get one client contact for change notifications: GTM publishes, plugin updates, DNS moves.
Runtime monitoring
- Run browser-based rendered checks at the right frequency for each page.
- Assert critical selectors: H1, CTA, price, add-to-cart.
- Capture and diff script inventories. Alert on new domains or large jumps.
- Capture console and resource errors. Prioritize uncaught exceptions.
- Monitor metadata changes: title, canonical, robots, meta description.
- Track structured data presence and schema integrity.
- Measure performance regressions that affect user flows: LCP, TBT.
Alerting and response
- Attach before-and-after screenshots, rendered HTML, and console logs to every alert.
- Document a triage flow for third-party changes: who to contact and how to roll back.
- Maintain an incident log with timeline, root cause, and remediation.
- Update baselines only after manual verification.
Governance and process
- Ask for change notifications on GTM publishes, major CMS template edits, and plugin or app updates.
- Maintain an approved script and domain allowlist for payment and other critical third-party scripts.
- Run periodic audits that combine rendered checks with crawling to find pages the team missed.
This checklist belongs in the SLA. It defines what you monitor and what the client must communicate.
Use Evidence to End the Argument
Monitoring does more than catch failures. It makes client conversations shorter.
When you can show timestamped rendered evidence, "we didn't touch it" stops being a dodge and becomes one line in a timeline.
Contract and communication tips:
- Add a clause that requires notice before broad GTM changes, major plugin updates, or DNS and hosting changes on defined pages.
- Define a monitor-only scope: which pages you watch and how often.
- Agree on what counts as an emergency: checkout regression, payment failure, site-wide noindex.
- Require the client to keep a contact who can quickly revert GTM publishes or plugin updates.
These guardrails do not stop vendors from breaking sites. They cut time to detection and time to rollback.
Rendered Evidence Beats Guesswork
Agencies can't control every script, plugin, or client edit. They can control detection and evidence.
Frequent rendered-page checks, script inventory monitoring, console and resource error capture, and approved baselines let you catch the changes you did not make. More important, they let you prove what changed and when.
If you want an evidence-first approach, DataJelly Guard focuses on the gap between 200 OK and a working page. Guard captures screenshots, rendered HTML, script and console signals, and baseline diffs. That helps teams detect silent revenue-page failures and bring evidence into triage. It does not replace QA. It gives you a faster way to see what broke — you can even run Guard's checks on any live URL in seconds.
Pick one revenue-critical page. Capture a baseline, run browser renders every few minutes, and save screenshots, HTML, and console logs. Next time someone says, "We didn't touch it," you'll have the timeline.
Your site returns 200 OK — but is it actually working?
Guard is the monitoring technology that catches the silent failures other tools miss. KeyPages.ai is where you turn it on. Audit any URL free first — no signup, results in 30 seconds.
Run a free page audit