Deploys Break Pages Your Logging Stack Won't Catch
Your logging and observability stack tracks status codes, latency, and stack traces, but a deploy can ship blank pages, broken third-party scripts, or wrong canonicals while every log stays clean. Here's why, and the rendered checks that close the gap.
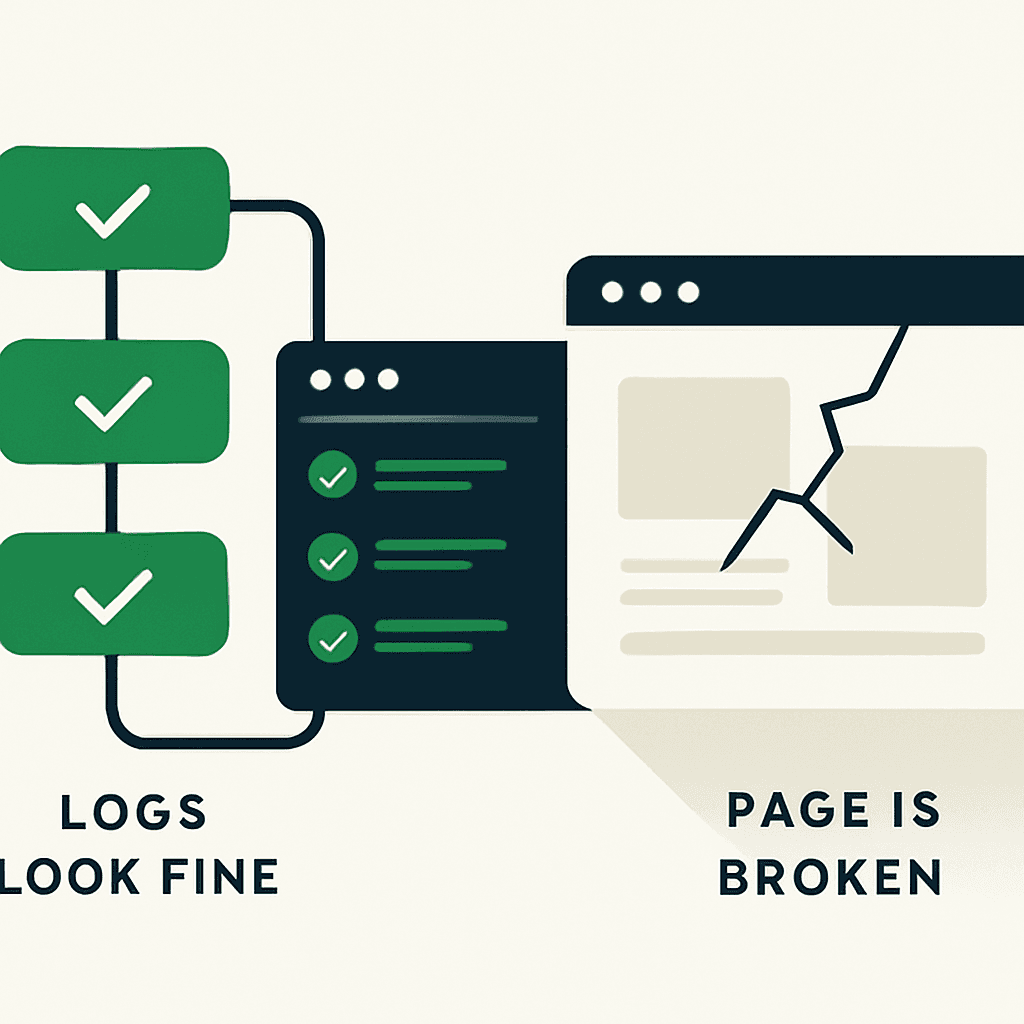
You shipped a release. CI passed. Logs show 200s. Users still got blank pages, missing content, and SEO damage. That gap matters. Logs are necessary, but they only tell you the server returned bytes. They do not tell you whether a browser rendered a working page. Many deploy failures never trigger a server error. They show up only in the page users and crawlers actually see. This post explains why, shows the failure modes, and gives you checks to catch them before users do.
Why server logs lie about page health
Server logs capture status codes, latency, and sometimes render stack traces. They rarely capture what happened after the browser got the HTML. A 200 can still ship an empty shell, bad meta tags, or a script that explodes on load. Common reasons:
- Client-side errors: JavaScript throws after the response is served. The status code stays 200.
- Third-party failures: Ads, analytics, or tag managers can block rendering or rewrite the DOM. Your server logs never see it.
- SSR/CSR mismatches: The server sends valid HTML, then hydration fails and the UI turns blank or dead. The server thinks everything worked.
- CDN and caching: A cached 200 at the edge can hide a backend failure that hits only some users. Origin logs look clean.
- Feature flag or config drift: Deploys flip flags or inject runtime config. One bad value can strip content while the server still returns 200.
- Wrong metadata: Canonicals, robots directives, and structured data live in HTML. A template bug can poison thousands of pages without logging an error.
Concrete failure examples
Blank page after deploy: A React SSR app returns server HTML, but the client bundle throws on a missing polyfill. Server logs stay clean. Users get a white screen. Example console error: "Uncaught ReferenceError: regeneratorRuntime is not defined". Hydration aborts. The page stays blank.
Wrong canonical tag: A key landing page had its canonical overwritten by a template variable. When a new content field shipped, the template defaulted to the homepage URL. The site returned 200 for millions of requests. Search traffic dropped roughly 12% over two weeks before anyone caught it. (This is exactly the class of failure covered in SEO Features Are Not Production Monitoring.)
Broken third-party script: An analytics vendor shipped a new snippet that used document.write during load. It blocked rendering because it ran synchronously and failed under a CSP policy introduced in the deploy. Your logs were clean. The vendor saw failures. You didn't.
Missing content from feature flags: A release flipped a server flag that stripped product descriptions from HTML for anonymous users. Logs showed normal traffic while conversion quietly slipped for anonymous sessions.
Resource race: A deploy swapped asset hostnames. Some clients sat behind corporate firewalls that blocked the new domain. CSS never loaded. The site looked broken. The origin still returned 200s.
Why synthetic request checks are not enough
Basic synthetics like curl and raw HTTP GET checks test availability. They do not test whether the page actually works. curl misses:
- Dynamic content loaded by JavaScript.
- DOM mutations from third-party scripts.
- Meta tags after client-side rendering.
- Visual layout regressions.
It also gets fooled by CDNs serving stale HTML. Plenty of teams run curl checks against health endpoints and call it coverage. It isn't. The browser is the runtime. Inspect rendered output, not just response bytes.
Your site returns 200 OK — but is it actually working?
Guard is the monitoring technology that catches the silent failures other tools miss. KeyPages.ai is where you turn it on. Audit any URL free first — no signup, results in 30 seconds.
Run a free page auditWhat to validate after a deploy: a prioritized checklist
Treat every deploy like a production experiment. Check the page the way a browser does. Start here:
- Visual snapshot: Take a headless browser screenshot of critical pages.
- DOM assertions: Verify key selectors and text exist, such as the product title, CTA, or article body.
- Meta checks: Extract and compare canonical, robots, hreflang, and structured data (JSON-LD).
- Console errors: Capture JavaScript exceptions and stack traces during load.
- Third-party health: Confirm critical third-party scripts loaded and did not block rendering.
- Performance smoke: Measure first contentful paint and Time to Interactive for obvious regressions.
- Network checks: Ensure critical assets return 200 and are not blocked by CSP or CORS.
- Visual diff: Compare screenshots against a known-good baseline and fail on large pixel deltas.
Run these checks against several pages from multiple geographies. Example thresholds:
- Fail if >1 console.error appears in the first 10s.
- Fail if key selector text length < 30 chars.
- Fail if canonical deviates from the expected string.
Sample headless check using Puppeteer
Use a real browser. That is the point. The Node.js example below loads a page in Chromium, captures console errors, extracts the canonical, and takes a screenshot. This catches client-side failures your logs miss. Code (conceptual):
const puppeteer = require('puppeteer');

async function validate(url, expectedCanonical) {
  const browser = await puppeteer.launch({args:['--no-sandbox']});
  const page = await browser.newPage();
  const errors = [];

  page.on('pageerror', e => errors.push(e.message));
  page.on('console', msg => { if (msg.type() === 'error') errors.push(msg.text()); });

  await page.goto(url, {waitUntil: 'networkidle2', timeout: 30000});

  const canonical = await page.$eval('link[rel="canonical"]', el => el.href).catch(() => null);
  const mainText = await page.$eval('#main', el => el.innerText).catch(() => '');
  await page.screenshot({path: 'snapshot.png', fullPage: false});

  await browser.close();
  return {errors, canonical, mainText};
}
Run this in CI after deploys. If errors.length > 0, canonical !== expectedCanonical, or mainText.length < 50, fail the deploy or block the rollout. (DataJelly Guard runs the same browser-level assertions on a schedule and after every deploy, so you get this coverage without maintaining the harness yourself.)
Operational details: where and when to run these checks
Run rendered checks during the deploy pipeline and after traffic ramps. The first pass catches build regressions. Follow-up checks at 5, 30, and 120 minutes catch third-party changes and config propagation failures. Run from multiple regions and ISPs. If APAC has a bad CDN edge, a single check from one datacenter will miss it.
For large sites, sample representative pages: homepage, top product pages, signup flows. For content sites, sample listings, detail pages, and AMP. If you serve different builds by cookie or header, run checks for each variant.
Expect some flakiness from third parties. Run each check three times with small jitter. Escalate only on reproducible failures.
Escalation rules:
- Immediate rollback candidate: blank page, persistent hydration exceptions, or a canonical pointing to the wrong domain.
- Pager-worthy: major third-party blocking, persistent structured-data removal, or >10% of sampled pages failing.
- Ticket: a regression isolated to one page or a small subset.
Visual regression and automated triage
Pixel diffs catch failures DOM assertions miss: collapsed layouts, missing images, broken fonts, or third-party overlays. Use a perceptual diff algorithm such as SSIM or a library like resemble.js with a small tolerance. But visual diffs are noisy. Pair them with DOM assertions and console error counts to separate real breakage from churn.
Example pipeline: capture a screenshot, diff it against baseline, and if delta > 3%, inspect console errors. If console errors > 0, fail fast. If the console is clean, flag it for human review. That cuts false positives without losing the safety net.
Wrap-up: close the gap between logs and rendered reality
Logs tell you the origin served bytes. They do not tell you whether those bytes became a usable page. Deploys change JavaScript bundles, templates, config, and third-party behavior. Any one of them can break UX or SEO without producing a server error.
Add rendered checks to deploy validation: headless browser snapshots, console error capture, DOM assertions, meta verification, and visual diffs. Run them from multiple locations. Treat some failures as rollback signals, not debugging chores for later. If your observability stops at the server response, you are blind to a whole class of failures. Browser-level checks close that gap.
Run the Puppeteer check on your next deploy. It will catch the breakage your logs politely ignore, before customers or Google get there first. For the complete set of checks to run on every release, see the post-deploy production page checklist. If you would rather not maintain a homegrown suite, DataJelly Guard runs these rendered checks automatically after every deploy — explore the dashboard or audit a page for free.
Your site returns 200 OK — but is it actually working?
Guard is the monitoring technology that catches the silent failures other tools miss. KeyPages.ai is where you turn it on. Audit any URL free first — no signup, results in 30 seconds.
Run a free page audit