Homepage Isn't Enough: Which Pages to Monitor
A practical guide to monitoring business-critical pages beyond the homepage: pricing, signup, checkout, docs, account, landing, and high-traffic SEO pages.
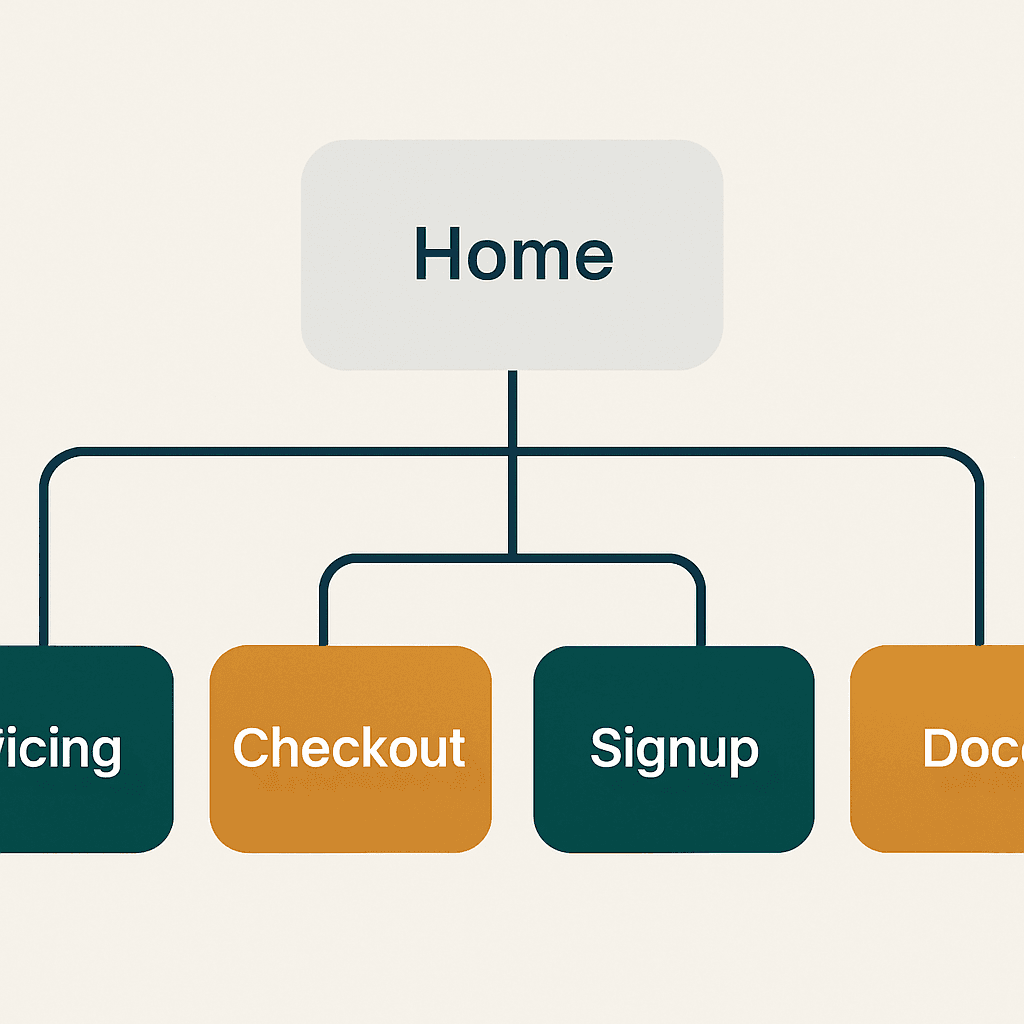
Monitoring only the homepage is lazy and expensive. It tells you the front door works while revenue leaks out the side. Users who pay, sign up, or depend on your docs usually never start there. This guide covers the pages that actually matter, how to rank them, and the monitoring patterns you can ship next sprint.
Why the homepage-only approach fails
Homepage checks give you shallow confidence. They catch obvious outages and big slowdowns. They miss the failures that hurt the business:
- Checkout errors hidden behind feature flags or A/B tests.
- Signup flows that break only in specific countries or browsers.
- Docs or API pages with SEO regressions that cut new user acquisition.
- Account pages that fail after permission changes.
Real examples: A SaaS team had a homepage returning 200 OK while the page was actually broken — their Stripe webhook route returned 500s during peak traffic, and revenue dropped noticeably that day. In another case, a campaign sent users straight to a landing page. The homepage stayed green, but conversions cratered because a JavaScript bundle never loaded on that page.
Homepage-only monitoring creates false confidence and misses real damage. The job is not to check a URL. The job is to protect user journeys and business outcomes.
Which pages you should monitor (and why)
Monitor pages that drive revenue, acquisition, retention, or support load. Cover core journeys and high-traffic SEO pages. Start here:
-
Pricing pages — revenue intent. Pricing pages correlate with signups and demo requests. Monitor load time, 200/500 status, A/B variants, and visible price text changes. Example metric: pricing → signup conversion rate.
-
Signup / conversion pages — new customers. Small JS errors or third-party script failures can block signups. Monitor form submit success, field validation, and third-party auth (Google, Apple, SAML). Synthetic test: complete signup with a test account.
-
Checkout / billing flows — direct revenue. Multi-step flows break often. Monitor successful purchases, payment gateway timeouts, coupon handling, and 3DS flows. Example: run a synthetic $1 sandbox purchase every 4 hours.
-
Campaign landing pages — acquisition and ad spend. These pages often ship custom scripts and parameterized URLs. Monitor UTM handling, tracking pixels, and redirects.
-
Documentation and API reference — developer experience and SEO. Broken docs raise support volume and lower trial-to-paid conversion. Monitor render success, code sample formatting, and canonical/meta tags.
-
Account and settings pages — retention and billing control. Users churn when they cannot update billing, cancel subscriptions, or configure integrations. Monitor authenticated routes, permission-specific views, and identity provider sessions.
-
High-traffic SEO pages — organic acquisition. Broken canonicals or slow pages cut inbound traffic. Monitor key landing pages, ideally the top 50 by organic sessions, plus Core Web Vitals and meta-tag integrity.
-
Feature-specific pages (docs, calculator, configurator) — power users. When power-user tools fail, churn follows. Monitor critical JS components, WebSocket connections, and data persistence.
Your site returns 200 OK — but is it actually working?
Guard is the monitoring technology that catches the silent failures other tools miss. KeyPages.ai is where you turn it on. Audit any URL free first — no signup, results in 30 seconds.
Run a free page auditHow to prioritize pages: simple rules
You cannot monitor every URL deeply. Rank pages by business impact instead:
-
Revenue first: rank pages by direct revenue impact. Example: Checkout > Billing > Upsell pages. If you have attribution data, assign each page expected weekly revenue and start with the top 20%.
-
Search traffic: rank pages by organic sessions. Pull impressions and clicks from Google Search Console or analytics. Monitor the top 50 organic pages.
-
Customer-impact score: combine support volume and feature criticality. Use a 1–5 scale: 5 = billing/checkout/account; 4 = signup/integrations; 3 = docs/FAQ; lower = blog index.
-
Deploy frequency: pages that change often need more checks. A landing page edited daily deserves more attention than a stale blog archive.
-
Lack of redundancy: pages tied to single points of failure, like bespoke third-party scripts or fragile serverless functions, move up the list.
Practical workflow:
- Pull the last 90 days of revenue attribution.
- Pull the top organic pages from Search Console.
- Pull the top support routes from tickets.
- Score pages with weights: revenue 0.5, search 0.3, support 0.2.
- Monitor the top N pages until you hit coverage goals.
For most mid-size apps, N = 20–50. Example: a mid-market SaaS at $120k monthly ARR might start with 12 pages: product pricing, signup, 2 checkout variants, docs onboarding, account billing, integrations listing, top 3 organic help articles, and 2 campaign landers.
What to monitor on each page (metrics and checks)
Use three layers: synthetic checks, Real User Monitoring (RUM), and content validation. For each page, monitor:
- Availability: 200/3xx responses, SSL validity, redirect chains.
- Functional correctness: API success codes, form submission success, correct post-login state.
- Performance: Time to First Byte (TTFB), First Contentful Paint (FCP), Largest Contentful Paint (LCP), and total blocking time.
- Content checks: visible prices, required CTAs, and meta tags such as canonical and robots.
- Third-party health: ad trackers, payment gateways, authentication providers.
- Edge cases: mobile vs desktop, country-based redirects, feature-flag variants.
A cURL healthcheck for API-backed pages:
curl -s -o /dev/null -w "%{http_code} %{time_starttransfer}s" \
  -H "Authorization: test" \
  "https://example.com/checkout/step1"
A simplified Puppeteer synthetic check:
const puppeteer = require('puppeteer');

(async () => {
  const b = await puppeteer.launch();
  const p = await b.newPage();
  await p.goto('https://example.com/signup');
  await p.type('#email', 'test+ci@example.com');
  await p.click('button[type=submit]');
  await p.waitForSelector('.welcome');
  console.log('Signup ok');
  await b.close();
})();
Also track business metrics: conversion rate, average order value, and abandonment between steps. Tie alerts to business impact. Example: a 5% drop in signup conversions over 30 minutes = P2. A 50% checkout failure rate = P1.
Monitoring architecture and automation
Use layers, not a single check:
- Lightweight synthetic probes: run endpoint status checks every 1–5 minutes for availability.
- Deep journey probes: run end-to-end flows in headless browsers every 15–60 minutes.
- RUM: collect real-user metrics and error traces on core pages to catch regressions synthetic tests miss.
- SEO watchers: run daily checks for canonical tags, meta changes, and redirects on high-traffic organic pages.
- Canary and feature-flag awareness: run checks per feature-flag cohort.
Automation tips:
- Keep test accounts and sandbox payment methods for end-to-end tests.
- Parameterize tests for A/B variants. Hit both variant A and B on landing pages.
- Run smoke checks in CI before deploys, then schedule synthetic runs after deploys.
- Map every monitored page to an owner. Every page needs a responder and a runbook.
Example CI job (pseudocode):
job: e2e-check
script:
  - npm run build
  - node ./tests/signup-check.js
on_fail: abort deploy
Runbook sections should include symptoms, first checks (logs, network traces), mitigation (rollback, disable feature flag), and a postmortem checklist.
Operationalizing priorities and closing thoughts
Monitoring is a product decision, not a vanity metric. Protect pages based on business impact and the cost of false positives. Start small: pick the top 10 pages by combined revenue and search traffic, then add synthetic and RUM coverage. Expand after you review incidents and find the pages causing friction.
Treat monitors like code: version-control scripts, review changes, and gate them behind PRs.
Final checklist:
- Catalog pages and owners.
- Run synthetic transactions for signup, checkout, pricing, and top campaign landing pages.
- Collect RUM for the top 50 organic pages.
- Alert on business-metric drops, not just status codes.
Deploys break flows in sneaky ways: a missing bundle, a changed CSS selector, a broken redirect, a missing meta tag. Homepage checks will miss that. Monitoring beyond the homepage catches it before revenue or traffic takes the hit.
If you want tooling that unifies synthetic journeys, RUM, and alerting for these pages, DataJelly Guard bundles those checks and business-metric alerts to cut time-to-detect and time-to-fix. You can see exactly what it monitors or run a free audit on any page right now.
List the 10 pages most tied to revenue or organic traffic. Add synthetic journeys and RUM, and run the same post-deploy production checklist against each one. Ignore the homepage vanity check and monitor the pages that can actually hurt you.
Your site returns 200 OK — but is it actually working?
Guard is the monitoring technology that catches the silent failures other tools miss. KeyPages.ai is where you turn it on. Audit any URL free first — no signup, results in 30 seconds.
Run a free page audit