Onboarding a New Client Site: Monitoring Setup Checklist
A practical onboarding guide for agencies to add monitoring fast: inventory key pages, capture a rendered baseline, define healthy states, route alerts, assign owners, and use a copy-ready checklist.
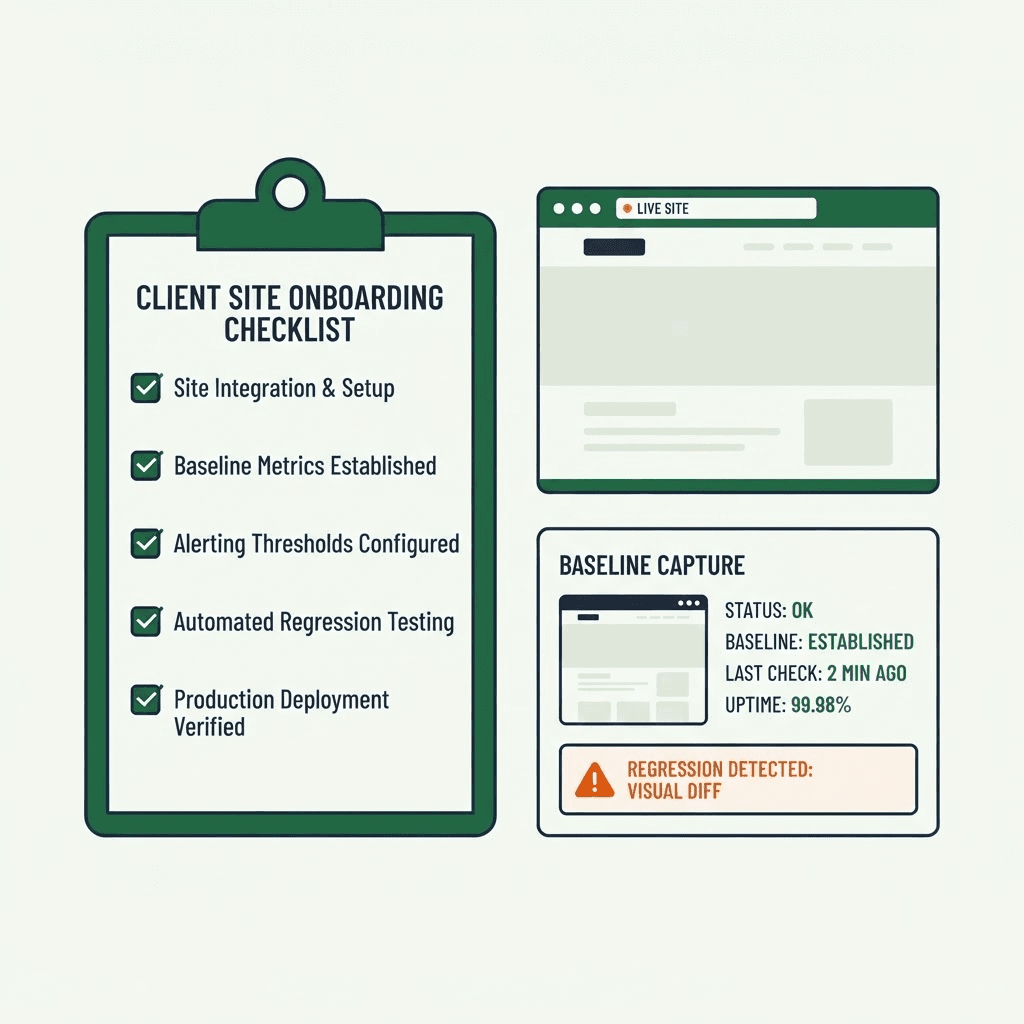
Make monitoring part of onboarding. Not a cleanup task.
A basic uptime check can say everything is fine while the page is still broken. You can get HTTP 200, valid SSL, and a healthy server while the customer sees missing CTAs, broken product images, JavaScript errors, accidental noindex tags, or a dead third-party script killing revenue.
This guide gives you a repeatable first-week process. Inventory the pages that matter. Capture a browser-rendered baseline. Define what healthy means. Route alerts to the right people. Document who owns the fix. Done right, this becomes SOP for every new client. If you are still deciding what to include per site, pair this with our guide on which client pages you should actually monitor.
1) Inventory the pages that matter
Start with a page inventory. Then rank pages by business impact. You do not need to monitor every URL on day one. Start with the pages that hurt revenue, leads, or visibility when they fail.
Tier definitions:
- Tier 1 — Revenue or conversion-critical. Monitor hourly or in near real time: checkout entry, cart, top product pages, pricing pages, login/account, promo landing pages with active ad spend.
- Tier 2 — SEO and funnel pages. Monitor 2–6 times per day: key category pages, high-traffic content, SEO landing pages, search results pages.
- Tier 3 — Low-impact pages. Monitor daily or weekly: about, policy pages, archive pages, low-traffic content.
Build the inventory fast:
- Ask the client for analytics access in GA4 or Adobe. Pull top pages by pageviews and transaction-driving URLs.
- Pull crawl or sitemap data: sitemap.xml, hreflang maps, and CMS exports by page type.
- For ecommerce, export a sample of SKUs that covers top sellers, variants, out-of-stock states, and image-heavy products.
- Pull paid landing pages and current ad destination URLs.
Output: a CSV with URL, page type, tier, agency owner, client owner, and notes. That file becomes your monitoring roadmap.
2) Capture a browser-rendered baseline
You cannot detect drift without a known-good state. Baseline every Tier 1 and Tier 2 page in a real browser during onboarding. Capture what the customer sees, not just what the server returns.
For each baseline, capture:
- Full-page screenshot and above-the-fold screenshot.
- Rendered HTML after JavaScript runs.
- Title tag, H1, canonical, robots meta, and meta description.
- Visible text length for key content blocks.
- Key DOM elements: CTA buttons, add-to-cart buttons, price elements, schema.org JSON-LD.
- Console and network failures: JS exceptions, 4xx/5xx resource errors, slow third-party calls.
- Third-party scripts and loaded versions: analytics, tag managers, payment scripts.
- Final URL and redirect chain.
Use practical tooling:
- Run a real browser with Playwright or Puppeteer.
- Capture at least two baselines: desktop and representative mobile.
- Annotate screenshots with the elements that matter: CTA, price, schema, form, product image.
Minimal example:
- A small Playwright script can open the page, wait for networkidle, save a screenshot, and dump document.documentElement.outerHTML. That is enough to create a baseline artifact.
Why it matters: a server-side 200 tells you nothing if the user gets an empty root node, a hydration failure, or missing schema. Rendered HTML and console logs expose silent frontend regressions—exactly what Guard monitors on every scan.
3) Define what healthy looks like
For each monitored page, write clear checks. No vague rules. No "looks okay."
Examples:
- Product page: title and H1 present; price element non-empty and matches regex ^$?\d+(.\d{2})?$; add-to-cart button visible and enabled; product image loads with HTTP 200; Product schema exists.
- Checkout entry: checkout button visible and enabled; required payment provider script loads; console errors stay below threshold N.
- Category page: product grid count >= X; pagination works; canonical points to self; noindex absent.
- Landing page: H1 contains campaign keyword; CTA visible; final redirect URL matches the expected domain and preserves UTM parameters.
Set thresholds with intent:
- For visual elements: the element must exist and be visible. Check boundingClientRect, display, and size.
- For counts: choose a minimum that reflects reality. Example: a top category page should show at least 8 products.
- For third-party latency: baseline median load times during onboarding, then alert on major regressions such as +200% over baseline.
Store these rules in the inventory CSV or a monitoring config file. These are the checks your monitor runs against rendered evidence.
4) Send alerts with evidence, not guesses
Good alerts cut noise and speed up triage. "Page broken" is not an alert. It is a shrug.
Route alerts by severity:
- Tier 1: send to the agency frontend on-call and the client ecommerce tech lead. Use high-priority Slack, SMS, or PagerDuty, plus email.
- Tier 2: send to the agency PM and client marketing lead. Route lower-severity alerts to Slack and a ticket queue like Jira or Trello.
- Daily digest: send low-priority content and SEO changes to the client editor group.
Every alert should include:
- A clear title: "[URGENT] Add-to-cart missing on product /sku/12345"
- Evidence: annotated screenshot, rendered HTML snippet around the missing element, console errors, request waterfall snapshot, final URL, redirect chain.
- Baseline diff: what changed since onboarding. Example: title removed, CTA missing, schema removed.
- First steps: reproduce in a clean browser, revert the last deploy, disable a new tag, review recent CMS edits.
Delivery and escalation:
- Primary: Slack webhook to a dedicated channel with screenshot and a link to rendered HTML.
- Fallback: PagerDuty or SMS for Tier 1 regressions outside business hours.
- Ticketing: auto-create an incident ticket with mapped priority.
Example webhook payload: { "text": "[ALERT] Missing Price on Product /sku/12345", "attachments": [ {"title": "Screenshot", "image_url": "https://.../screenshot.png"}, {"title": "Rendered HTML", "text": "<div id="price"> </div>"} ] }
Expect a 1–2 week tuning period after launch. Tighten rules. Add exceptions where the client changes content often.
Your site returns 200 OK — but is it actually working?
Guard is the monitoring technology that catches the silent failures other tools miss. KeyPages.ai is where you turn it on. Audit any URL free first — no signup, results in 30 seconds.
Run a free page audit5) Assign owners before the first alert fires
Monitoring without ownership is theater. Decide who acts when a regression hits.
Roles:
- First responder at the agency: triage the alert, gather evidence, reproduce in a clean browser, and identify the likely cause: deploy regression, CMS edit, third-party script failure, or redirect bug.
- Client technical owner: handles server, hosting, or CMS rollback work on the client side.
- Agency engineer: rolls back or patches agency-controlled frontend code, JavaScript, or tag changes.
- Agency PM or comms owner: updates the client through the agreed channel until resolution.
- Postmortem owner: writes a short postmortem for higher-severity incidents with timeline, root cause, fix, and prevention steps.
Rules that save time:
- If the alert fires within 30 minutes of a deploy, treat it as a deploy regression first and notify the deploy owner automatically.
- If a third-party script fails, validate on staging and check fallback behavior. Shared responsibility is common. Write the decision rules down in advance.
- Keep the on-call schedule in the onboarding packet and in PagerDuty or your equivalent.
Record responsibilities in the onboarding doc and get client signoff. Do it before something breaks. This is also how you turn client site monitoring into a retainer line item—clear owners make the value obvious.
6) Handle the messy cases up front
Every site has edge cases. Plan for them early.
A) Sites you did not build:
- Start with a discovery call with the original engineers, hosting provider, and client.
- Learn deploy paths and release cadence.
- Baseline first. Touch nothing until you have render evidence.
- Use conservative alerting until ownership is clear.
B) Heavy third-party scripts and marketing tags:
- Inventory every third-party script.
- Baseline load times and error rates.
- Alert on major latency regressions and 4xx/5xx script fetch failures.
- Alert when a vendor URL or version hash changes. That can catch unauthorized swaps.
- Have a fallback plan. If an analytics tag blocks rendering, know how to disable it fast or shim core functionality.
C) Mixed page types across ecommerce, lead-gen, and content:
- Use page-type-specific rules.
- Ecommerce: price, images, add-to-cart.
- Lead-gen: forms, CAPTCHA, tracking parameters.
- Content: canonical, H1, structured data.
- For large catalogs, monitor top sellers and rotate random SKU samples weekly.
D) Clients who edit content constantly:
- Set a change window.
- Ask for a content-change webhook or feed if one exists.
- Tighten monitoring outside that window.
- For editorial churn, alert on structural regressions like missing CTA, noindex added, or schema removed. Do not alert on every text edit.
E) Payment and PCI-related pages:
- Inventory checkout scripts and date the record.
- Capture script src, integrity attributes, and iframe URLs for payment flows.
- Alert on new scripts, script source changes, and header changes that affect security such as CSP or X-Frame-Options.
- Store artifacts for review if needed. This supports evidence collection. It does not replace PCI review with your QSA, acquirer, or compliance-accepting entity.
7) Baselines make change detection useful
A baseline is not a screenshot archive. It is your definition of known-good.
Without a baseline, monitoring gets dumb in one of two ways:
- Too noisy: it alerts on every minor difference.
- Too blind: it misses silent frontend failures.
Use a simple process:
- Capture one baseline for desktop and one for mobile for every monitored page type.
- Run a 7–14 day calibration period where alerts go to a review channel, not the on-call rotation.
- Refine thresholds based on real content churn and normal variance.
- When a major redesign ships, accept a new baseline and archive the old one.
When a real regression happens, the diff should be short and useful: missing nodes, changed text length, failed scripts, screenshot comparison.
Example: a product page baselines with a visible add-to-cart button. A later deploy throws a hydration error and leaves an empty #root. Uptime still reports 200. Render-based monitoring shows a blank page, console errors, and a missing CTA in the DOM. That points straight to a frontend regression.
8) Turn it into a runbook: copy-ready checklist
Use this checklist in every client kickoff packet.
Copy-ready New-Client Monitoring Onboarding Checklist
- Discovery and Inventory
- Get GA4 or analytics access and export top pages by pageviews and transactions.
- Download sitemap.xml and CMS page list.
- Identify paid landing pages and current ad URLs.
- Create CSV: URL | Page type | Tier (1/2/3) | Agency owner | Client owner | Notes.
- Baselining (desktop + mobile for Tier 1 & 2)
- Capture full-page screenshot and above-the-fold screenshot.
- Save post-JS rendered HTML.
- Record title, H1, canonical, robots meta.
- Capture visible text length and key element selectors (CTA, price, product image).
- Capture console and network failures and list third-party scripts.
- Archive artifacts in an object store or repo with timestamps.
- Expectations and Rules
- For each monitored URL, write rules such as "add-to-cart present," "price matches regex," and "product schema exists."
- Set thresholds for counts and performance such as max console errors and tag latency thresholds.
- Assign severity levels (P0, P1, P2) for each rule.
- Alerting and Routing
- Configure Slack, PagerDuty, or webhook channels with screenshot and HTML attachments.
- Map severity to recipients. Example: Tier 1 -> on-call + client tech lead. Put names and contact info in the doc.
- Configure automatic ticket creation for P1+ incidents.
- Responsibilities and Escalation
- Document first responder, client owner, agency deploy owner, and communication owner.
- Publish on-call schedule and escalation timelines.
- Agree on deploy windows and client notification process.
- Special Cases
- Inventory third-party scripts and flag high-risk vendors.
- Add script-change alerts for payment pages and any PCI-relevant pages.
- Set up rotating SKU sampling for large catalogs.
- Calibration and Handover
- Run monitoring in learning mode for 7–14 days and tune rules to cut false positives.
- Give the client a short runbook: what to expect when an alert fires.
- Store baselines where both teams can reach them and document how to accept a new baseline after redesigns.
- Postmortem and Continuous Improvement
- For P1 incidents, run a 72-hour postmortem with timeline, root cause, fix, and prevention steps.
- Review monitoring rules quarterly and add or remove URLs as business priorities shift.
Require client signoff on owners and escalation paths.
9) Use tools that capture what users saw
Modern page monitoring is about evidence: screenshots, rendered HTML, console logs, and script inventories. That evidence makes alerts actionable and cuts finger-pointing.
If you are evaluating tools, pick ones that capture browser-rendered evidence, not just HTTP responses. They speed up triage because you can see what the customer saw.
DataJelly Guard is one example. It captures screenshots, rendered HTML, console errors, and page-type-specific signals so teams can detect silent revenue-page failures that uptime checks miss. You can even run its checks on any live URL during onboarding to capture a first baseline. Use it, or a similar evidence-focused tool, to make alerts useful. It helps detect failures and collect reviewable evidence. It does not replace QA.
Paste the checklist into your onboarding packet, baseline your Tier 1 pages this week, and start alerting on rendered failures—not just HTTP 200s.
Your site returns 200 OK — but is it actually working?
Guard is the monitoring technology that catches the silent failures other tools miss. KeyPages.ai is where you turn it on. Audit any URL free first — no signup, results in 30 seconds.
Run a free page audit