Website Functionality Monitoring: How to Know a Page Actually Works
Monitor website functionality beyond load times. Practical checks, examples, and a framework to verify pages perform their intended jobs in production.
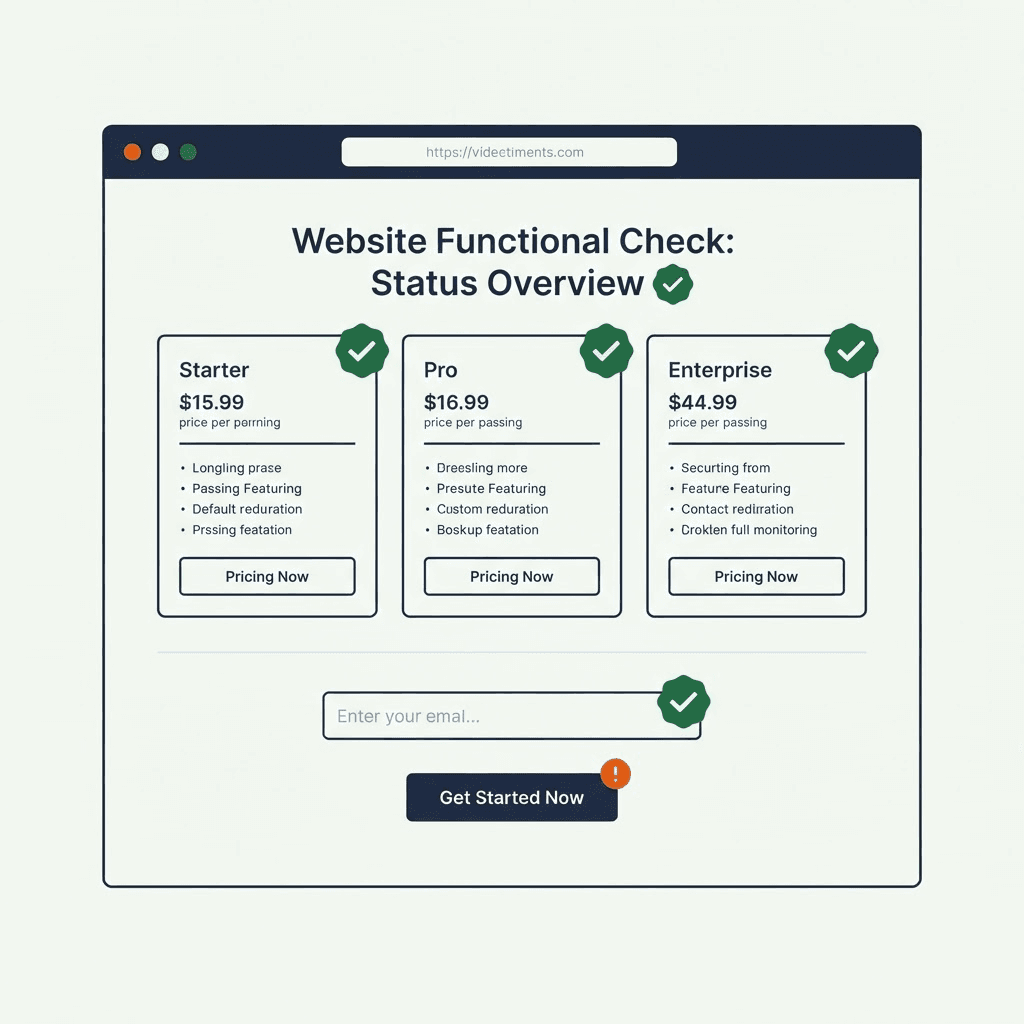
Loading fast isn't enough. In production, users expect more than a 200 OK. Pricing pages must display plans and working CTAs; signup should accept input and progress; login must authenticate; search should return usable results; and checkout should allow users to continue. This article explains website functionality monitoring in plain language and offers a framework to verify that critical pages perform their jobs, not just render. We'll distinguish between "URL loads" and "page accomplishes its job," show how to combine browser rendering with content checks and interactions, and provide practical guidance to avoid turning production monitoring into a giant automated QA suite. You don't need DataJelly Guard to understand the ideas, but you can use it to implement these checks in real systems.
What "loads" vs. "functions" mean in production monitoring
Uptime checks that ping a URL and assert 200 are a baseline, not a cure. A page can return 200 after a deployment while the UI is blank, a script crashes, or a critical CTA disappears. In production, that gap leaks revenue. Functionality monitoring asks if a page actually performs its core job, not just renders without a server error. Think in a spectrum:
- URL loads (HTTP 200, response timeliness, basic rendering)
- Browser-rendered evidence (what users see, DOM state, text, structure)
- Content correctness (presence of expected text, images, pricing, CTAs, forms, validations)
- Interactions (complete meaningful user flows with valid inputs, state transitions, side effects)
- Dependencies (third-party scripts, analytics, ads, payment scripts) – do they load, execute, and cooperate
Each slice adds confidence that a page is useful, not just available. The goal isn't a QA moat. It's a small set of meaningful checks that protect critical jobs in production.
Identify the purpose of each critical page
Every important page should have a clear, testable job. Common page types and what "success" looks like:
- Pricing page: shows plan options, prices, features, and a working "Choose plan" or "Start trial" CTA that leads to signup or checkout. No missing plans, misaligned pricing, or broken CTAs.
- Sign-up page: accepts input (email, password, consent), validates on client and server, and advances to the next step (verification or onboarding).
- Login page: authenticates with correct credentials, handles errors gracefully, and redirects to the intended page or dashboard.
- Search/results page: accepts a query, returns relevant results, and supports facets or filters without a reload.
- Checkout entry page: starts a secure flow, loads the cart, applies promotions, and proceeds to payment or next step.
- Product or catalog pages: render product cards with images and prices, allow filtering/sorting, and enable a working add-to-cart path.
These are concrete user journeys. Functionality monitoring asks: Can a user complete this journey on a real device, in a real browser, with real data, under realistic network conditions?
A practical framework for "what must be true"
Use a lightweight, page-type–specific checklist. Start with a minimal, stable baseline and extend as needed. Here's a practical framework you can adopt:
-
Page identity and rendering
- The page loads with HTTP 200 and renders without fatal errors.
- The title, H1, and canonical tag appear as expected.
- Visible text exceeds a minimum threshold to catch blank renders.
-
Core content presence
- Key content blocks exist (pricing plans with names/prices, product title and price, signup fields, etc.).
- Critical CTAs are visible and enabled (e.g., Add to Cart, Sign Up, Buy now).
- Metadata (schema, noindex, robots) remains correct.
-
Interaction viability
- Input fields accept data and client-side validation runs.
- Submitting a form advances to the expected URL or shows a meaningful error.
- A basic user flow completes (e.g., login → dashboard, signup → onboarding, search → results).
-
Dependency health
- Third-party scripts (analytics, chat, payment) load without console errors.
- External resources (images, fonts) load within acceptable latency.
- No fatal script errors block core interactions.
-
Resilience to changes
- A stable baseline for selectors (CSS classes, IDs) exists to prevent false alerts.
- Deploys that alter layout don't silently break core functionality without detection.
-
Security and accessibility signals
- Critical forms enforce client-side validations and accessibility landmarks are present.
- Important content remains readable and navigable with assistive tech.
A simple, non-disruptive workflow to implement
Below is a lightweight workflow to start monitoring functionality without turning production into QA automation:
- Catalog critical pages and define job statements
- List core jobs for each page type.
- Write a one-sentence success criterion per page type (e.g., "Pricing page shows all plans and each CTA navigates to signup").
- Choose a minimal set of checks per page type
- Pick 4–6 checks per page from the framework above. Focus on content presence, element visibility, and at least one meaningful interaction.
- Use stable selectors (data attributes or stable IDs).
- Implement synthetic checks with browser rendering evidence
- Use a browser-based checker that loads the page, captures a screenshot, renders HTML, and reports final URL, title, and key content signals.
- Capture console errors and resource loading failures for quick triage.
- Normalize signals into a compact report
- Output a runbook-style report: pass/fail per check, a screenshot, and a short anomaly narrative.
- Include the final URL, redirects, and page-type evidence.
- Create alert thresholds that avoid fatigue
- Don't alert on every minor layout shift. Alert on missing CTA, broken signup path, or a non-functional login.
- Allow normal content drift, but clamp risk of critical flows failing silently.
- Review and governance
- Pair checks with a short justification: why it matters for users and business goals.
- Prune stale checks quarterly and adjust for product changes.
This workflow keeps monitoring lightweight, targeted, and useful. It catches silent failures that degrade user experience without becoming a QA lab. It also pairs naturally with a post-deploy page checklist so every release gets the same functional review.
Concrete check patterns you can implement today
These patterns work across page types and map to signals you can collect from a browser-based monitor or lightweight test runner.
-
Presence and visibility checks
- Is the main heading present and visible? Is the primary CTA visible and enabled?
- Are essential blocks present (pricing cards, product title, price, image)?
-
Content integrity checks
- Are prices formatted correctly (currency symbol, decimals)?
- Are key terms displayed (e.g., 'Free trial', 'Monthly', 'Checkout')?
-
Form and input checks
- Do signup/login forms render? Do fields accept input? Does validation appear for invalid input?
- Does submitting signup advance to verification or onboarding URL?
- Does login submit and redirect to the intended location?
-
Interaction and flow checks
- Click a plan CTA and confirm navigation to signup or checkout.
- Enter a query and verify results load and can be filtered.
- Add a product to cart and verify the cart updates and shows a summary.
-
Dependency and script checks
- Report if a critical script (e.g., payment) fails to load or throws a console error.
- Detect slow third-party scripts that delay actions beyond a threshold.
-
Resilience checks
- Simulate a network hiccup and verify the page still renders and basic interactions stay possible after retry.
- Verify continuation of a journey after a redirect (e.g., login to original page).
Keep these patterns in a small, page-specific manifest for coverage that catches business-impacting issues without a maintenance nightmare.
A practical example: monitoring a pricing page
Let's walk through a concrete example. A pricing page offers three plans: Starter, Growth, Scale. Success criteria:
- The page loads with 200 and shows all three plan cards.
- Each card displays name, price, features, and a CTA to signup.
- The Compare or Monthly/Annual toggle works and updates cards.
- The primary CTA is visible and enabled for each card.
- No critical script errors appear in the console.
- The page title and H1 reflect Pricing and avoid noindex or canonical issues.
Implementation notes:
- Use stable selectors like data-pricing-card="starter/growth/scale" and data-cta="choose-plan".
- Validate that the CTA navigates to /signup with the selected plan as a parameter.
- Verify that the toggle updates prices and highlights the active plan.
- Capture a screenshot and the rendered HTML; ensure plan names and prices appear in the DOM with correct values.
Failure scenarios:
- A plan card is hidden due to CSS regression.
- The CTA becomes disabled because of a script error.
- The toggle fails to update prices or only partially updates a card.
- The page returns 200 but shows a migration banner that blocks CTAs.
Document these checks as a simple pricing-page manifest to create a durable baseline signaling deploy breaks.
Your site returns 200 OK — but is it actually working?
Guard is the monitoring technology that catches the silent failures other tools miss. KeyPages.ai is where you turn it on. Audit any URL free first — no signup, results in 30 seconds.
Run a free page auditA simple checklist you can adapt for any critical page
Use this compact, page-specific checklist to ramp up quickly. Copy, adapt, and keep it lean:
-
Page identity
- 200 OK and no blocking console errors
- Title, H1, and canonical present and correct
- Important content visible (text length > threshold)
-
Core content and structure
- Required blocks present (pricing cards, signup fields, login button, etc.)
- Key CTAs present and enabled
- Product/pricing data matches expected values
-
User interactions
- Form fields accept input and validate
- Submitting forms goes to the correct next step
- A basic flow completes (e.g., sign-in to dashboard, add-to-cart to cart view)
-
Dependencies and performance
- Critical scripts load without errors
- Third-party resources load in time
- No excessive layout shifts during interactions
-
Resilience and governance
- Minor changes don't trigger false alarms
- Justification for each check exists
- Annual pruning of checks and governance cadence
This checklist stays focused on user outcomes, not surface metrics. It's small but covers jobs important to most pages in production.
How to connect checks to production monitoring without overreach
Functionality monitoring can become QA automation. The cure is discipline and scope:
- Start with one or two critical pages and 4–6 checks each. Expand only when value is clear.
- Use page-type manifests to prevent drift. If a page changes, update the manifest and checks.
- Separate uptime from functionality signals. Uptime verifies availability; functionality verifies job completion.
- Tie checks to business outcomes. If a pricing page shows all plans, does the CTA reliably lead to signup? If a login fails, can users reach their account after authentication?
- Keep evidence actionable. Screenshots, DOM snapshots, and console logs should point to a fix, not just an alert.
This yields a practical posture: you know when a URL loads and when a page actually helps users accomplish its job. The goal isn't perfect coverage of edge cases; it's robust signals for critical flows that drive revenue and satisfaction.
Putting it all together: a minimal implementation outline
Here's a weekend-friendly blueprint:
- Define a page catalog: critical pages with a short job statement.
- Create a per-page manifest: 4–6 checks, selectors, and expected outcomes.
- Build a browser-based synthetic task for each page:
- Load the page
- Capture screenshot and rendered HTML
- Run scripted checks (presence, content, interactions)
- Report results with a verdict and evidence
- Integrate with alerting: escalate only when a critical flow fails or multiple checks breach thresholds.
- Schedule cadence: tighter checks during early deployments, lighter checks in steady state to reduce noise.
This approach improves real-world reliability without turning production into a QA lab. It also links monitoring signals to user experience.
How DataJelly Guard relates (briefly and practically)
DataJelly Guard monitors critical production pages and alerts when they silently break. It emphasizes browser-rendered evidence: screenshots, rendered HTML, final URL, title, visible text, DOM signals, console and resource errors, and page-type signals. The guidance here is platform-agnostic, but Guard supports per-page manifests, key browser signals, and surfaced evidence when a page regresses. If you evaluate Guard, you'll gain concrete visibility into whether a page loads and lets users complete its intended job — you can even run a free page audit on any live URL to see the rendered evidence for yourself.
Key takeaways and practical guardrails
- Differentiate between URL loads and page outcomes. Use both uptime and functionality checks.
- Treat each critical page as purposeful: define success criteria tied to user journeys, not visuals.
- Use a small, stable set of checks per page. Prioritize presence, content correctness, and at least one meaningful interaction.
- Avoid turning production into a QA suite. Keep checks scoped, maintainable, and tied to business outcomes.
- Capture browser-rendered evidence to speed triage: screenshots, HTML, console errors, and resource loads.
- Regularly prune and adjust checks as product features evolve. Maintain a lightweight governance cadence.
Functionality monitoring, browser monitoring, synthetic monitoring, and production monitoring aren't buzzwords. They're a disciplined way to ensure customers can use your site as designed, not just see a page render.
Closing thought
If a page returns 200 but can't help a user accomplish its purpose, it harms your conversion funnel and trust. Functional website monitoring offers a practical, focused path to catch issues before they cost revenue or engagement. Start small, keep checks meaningful, and scale as you gain confidence. Your users will thank you with smoother journeys and faster conversions.
Sources
A variety of public resources inform practical frontend monitoring concepts, browser behavior, and synthetic testing concepts. Useful sources include: MDN Web Docs, web.dev, Google Search Central, React/Next.js documentation for rendering and lifecycle behavior, and PCI/QA-related guidance where relevant to production-grade monitoring and data integrity.
A practical path forward: start with a small set of page-focused functionality checks, capture browser-rendered evidence, and treat the page's job as the metric you care about. When your critical pages can't help users accomplish their tasks, you'll know exactly what to fix.
Your site returns 200 OK — but is it actually working?
Guard is the monitoring technology that catches the silent failures other tools miss. KeyPages.ai is where you turn it on. Audit any URL free first — no signup, results in 30 seconds.
Run a free page audit