Real Browser Monitoring vs Uptime Monitoring: What's the Difference?
A practical comparison of real browser monitoring and traditional uptime checks. Learn what a ping or 200 OK proves—and what it misses—plus real-world examples and guidance for when to use each.
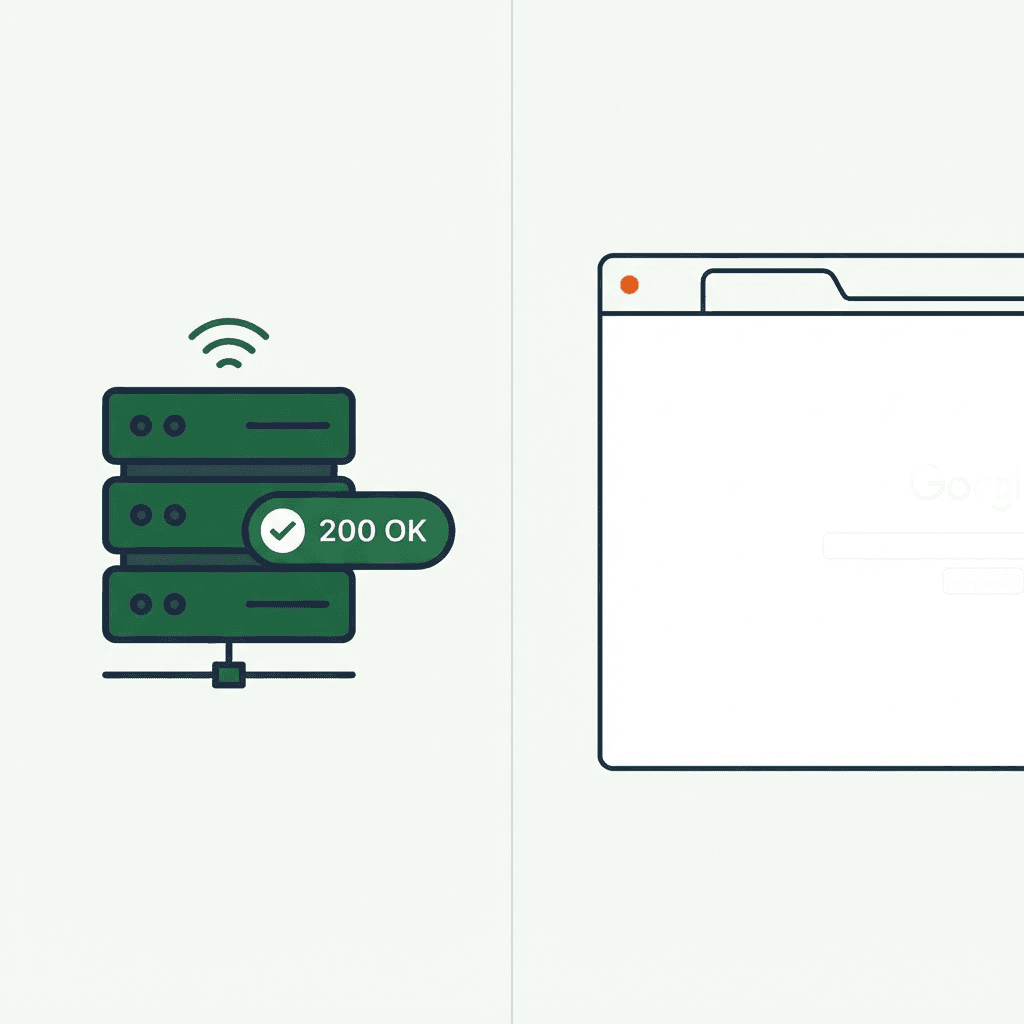
The gap between 200 OK and real user experience
When a page returns 200 OK, your job isn't done. Real users render fonts, scripts, images, and interactive elements. Traditional uptime monitors rely on ping tests, HTTP GETs, and status codes. They catch outages fast and cheaply, but miss many customer-visible failures: a blank page after a deploy, a broken checkout button, missing content, or silent JavaScript errors. This post contrasts real browser monitoring (RBM) with uptime monitoring, using concrete examples and practical guidance to show where each shines. The goal is to add browser-rendered evidence to your existing tooling, reflecting what customers actually see.
What uptime monitoring proves (and what it cannot)
Uptime monitoring is fast and simple. It issues lightweight HTTP requests from multiple locations, records status codes, response times, and a few headers. A 200 marks the page as up; a timeout or 5xx raises an alert. It's powerful for infrastructure failures, network outages, DNS problems, and server crashes. It can also surface performance regressions when response times rise beyond a threshold.
Uptime checks cannot prove user usability in a browser. A 200 does not guarantee correct rendering, complete asset loading, or a usable interface. Common failures include:
- Blank render after deploy: 200 response, but the client bundle fails to initialize.
- Missing critical content: HTML loads, but title, H1, price, or CTA are absent due to render-time races or templating errors.
- JavaScript errors and resource failures: A script fails to load or third-party scripts crash, breaking interactivity while the server returns 200.
- Blocked resources or CSP issues: Misconfigurations prevent UI from loading despite normal server responses.
- Broken interactivity: Buttons or forms appear usable but aren't (disabled add-to-cart, unresponsive signup, modals that won't open).
Uptime excels at detecting delivery outages but misses browser-side or perception failures. In practice, teams use uptime for infrastructure health and RBM for customer-perceived health.
What real browser monitoring proves (and what it catches that ping tests miss)
Real browser monitoring (RBM) runs checks that simulate a user's browser. It loads pages in a headless or real browser, renders HTML/CSS, executes JavaScript, and records what users actually see. This is the same rendered-output lens DataJelly Guard applies to production pages. RBM gives signals invisible to HTTP checks:
- Rendering correctness: Screenshots, rendered HTML, and visible text reveal blank pages or misrendered components.
- JavaScript health: Console errors, hydration failures, and runtime exceptions show up when scripts fail or components crash.
- Resource health: Missing or blocked assets surface as failed requests or blocked third-party resources.
- DOM and element state: Presence of title, H1, CTA, and form fields, plus metadata changes, indicate drift or wrong deployments.
- Interaction readiness: Whether buttons are clickable, forms submit, or modals open.
- Real-world performance: Pages can stall under load even if server latency is low; RBM surfaces rendering regressions.
RBM answers: can a user load the page, see the right content, and complete the intended action? It reveals issues uptime alone cannot.
Concrete scenarios: when results diverge
Here are scenarios where uptime monitoring and RBM diverge, with actionable implications for web teams.
- 200 OK, blank page after deploy
- Uptime: Pass (200 OK, within latency)
- RBM: Fail (blank or white screen, no usable UI)
- Why it matters: Users see nothing; conversions drop despite a green server.
- Pricing page missing CTA
- Uptime: Pass (HTML loads, 200 OK)
- RBM: Fail (CTA missing or hidden, page non-actionable)
- Why it matters: Conversion paths are blocked; experiments suffer.
- Third-party script blocks checkout
- Uptime: Pass (200)
- RBM: Fail (script blocks critical flows; checkout disabled or submission fails)
- Why it matters: A single dependency can derail revenue paths; uptime won't show it.
- Checkout entry with DOM mismatch
- Uptime: Pass (HTTP success)
- RBM: Fail (broken form, missing fields, wrong currency/locale)
- Why it matters: Friction at first contact hurts revenue.
- Product page with missing images or wrong price
- Uptime: Pass (assets and price endpoint respond)
- RBM: Fail (images 404, price incorrect)
- Why it matters: Visual fidelity and pricing drive decisions.
- Content drift after deployment
- Uptime: Pass if server is green
- RBM: Fail (title, H1, canonical misconfigurations, poor SEO signals)
- Why it matters: Content drift hurts trust and rankings.
Your site returns 200 OK — but is it actually working?
Guard is the monitoring technology that catches the silent failures other tools miss. KeyPages.ai is where you turn it on. Audit any URL free first — no signup, results in 30 seconds.
Run a free page auditWhen to rely on uptime vs. browser checks
Uptime monitoring stays foundational. Use it to confirm endpoints are reachable, responsive, and globally accessible. It's best for non-interactive resources (APIs, static assets, CDNs) and to detect outages, routing, DNS, or server crashes.
For customer-facing pages, add browser checks. As we argued in why "the site is up" is the most dangerous statement, a responding server tells you nothing about whether customers can use the page. Use RBM when:
- Client-side rendering or hydration drives failures.
- Critical conversions depend on rendering and interactivity.
- Third-party scripts can silently fail and degrade the UX.
- You need evidence that mirrors what users see, including screenshots, rendered HTML, console logs, and DOM state.
Most teams run both. Uptime underpins infrastructure visibility; RBM adds a customer-focused lens. Treat them as complementary, not exclusive.
A practical two-layer checklist
Use this flow to decide which signals belong to uptime checks and which to RBM. Tailor to your stack and priorities.
- Map critical journeys
- List revenue- or engagement-critical pages (home, product, pricing, cart, checkout, signup).
- Identify exact user actions (click CTA, submit form, proceed to payment).
- Define success criteria
- Uptime: HTTP 200 within latency budget; DNS and regional reach.
- RBM: Page renders quickly; key elements present (title, H1, CTA); no console errors; interactive elements usable; resources loaded.
- Set frequency and locations
- Uptime: Frequent checks from multiple regions; prioritize critical pages.
- RBM: Check every 15–30 minutes for critical pages, aligning with deploys.
- Instrument evidence
- Uptime: Status code, latency, headers, traces.
- RBM: Screenshots, final URL, rendered HTML, title/H1/canonical, visible text, DOM state, console logs, resource details, page-type signals.
- Tie alerts to impact
- Uptime: Outages affect availability.
- RBM: Rendering or interaction regressions affect conversions and usability.
- Remediation playbooks
- Uptime: Route to infra for latency or routing fixes.
- RBM: Route to front-end for hydration, assets, or script fixes.
- Review cadence
- Tune thresholds; track false positives.
- Maintain baselines for render times, content presence, and loads.
- Integrate with workflows
- Connect checks to CI/CD for early deploy signals. Pairing this with a repeatable post-deploy page checklist keeps coverage honest.
- Use dashboards that blend uptime and RBM data for a single reliability view.
This checklist operationalizes two layers: uptime for delivery reliability and RBM for user experience reliability.
Getting started: practical tips
New to real browser monitoring? Start without overhauling your stack.
- Pick core pages: home, product, cart, checkout entry, pricing. Target revenue-critical pages prone to silent failures.
- Define signals that reflect customer impact, not just tech minutiae. For example, track CTA visibility and clickability, not only script load.
- Capture meaningful evidence. Screenshots and rendered HTML quickly diagnose content discrepancies. Include console errors and network failures.
- Watch for content drift: title, H1, canonical, and noindex changes harm SEO and trust.
- Don't ignore third-party scripts. RBM helps catch script failures that halt checkout or block interactions.
- Tie deployments to RBM signals. Deploys should shift visible text, element presence, and interactivity.
- Keep alerts lean. Start with a few high-signal pages and expand as you gain confidence.
From a tooling view, ensure RBM delivers concrete evidence: algorithmic screenshots, rendered HTML, and a readable summary of failing elements. If evaluating a solution, ask for evidence that the page loaded as users expect, with interactive elements functioning.
Putting it all together: an example workflow
Here's a compact, end-to-end workflow balancing uptime and RBM for practical outcomes.
Step 1: Define critical pages and goals
- Homepage: ensure hero CTA is visible and navigates to product pages.
- Product page: confirm price, images, and Add-to-Cart are present and functional.
- Pricing page: ensure the subscription or purchase CTA is accessible.
- Checkout entry: ensure the checkout modal or page loads and the primary action is enabled.
Step 2: Establish baseline signals
- Uptime baseline: 99.9% monthly uptime from multiple regions; latency under 300 ms in-region for primary endpoints.
- RBM baseline: 95th percentile render time under 2 seconds; CTA visible within 1.5 seconds; no console errors; no broken resources.
Step 3: Implement checks
- Uptime: periodic HTTP GETs every 5 minutes from multiple geos.
- RBM: synthetic browser checks that load pages, capture screenshots, verify key elements, and log events. Browsing the full test catalog is a fast way to see which rendered signals you can assert.
Step 4: Alerts and escalation
- Uptime: notify on region outages or latency spikes.
- RBM: notify on missing elements, console errors, or failed interactions.
Step 5: Run and review weekly
- Compare uptime and RBM trends. A healthy site shows aligned uptime and stable RBM signals. If RBM drifts while uptime stays green, focus on UI components.
Step 6: Improve iteratively
- If a CTA disappears after a deploy, patch the deployment and re-run RBM.
- If a third-party script slows checkout, restrict its loading or switch to a more resilient integration.
This workflow operationalizes both layers and translates signals into product improvements.
DataJelly Guard: browser-rendered evidence
DataJelly Guard monitors critical production pages and alerts on silent breaks. Guard captures screenshots, rendered HTML, visible text, DOM and resource signals, console and network errors, and page-type signals. Guard embodies the concept: don't rely on a single metric to gauge user experience. Uptime checks reach the service; RBM proves users can actually use it. Guard's approach—capturing browser-rendered evidence and surfacing actionable signals—aligns with this article's guidance: use both layers to cover delivery and experience.
Scope and boundaries
The two-layer model is complementary. Real browser monitoring does not replace infrastructure monitoring. Performance dashboards, service-level indicators, and observability remain essential. RBM shines by surfacing customer-visible failures that 200 OK tests miss and by providing inspectable rendering and interactivity evidence. For commerce teams, silent checkout or cart failures cut revenue. For non-commerce sites, protect trust, accessibility, and search visibility. The objective is a reliable surface where both layers inform decisions and triage.
Two layers of monitoring are better than one. Use uptime to protect availability, and real browser monitoring to protect the experience customers actually rely on. When in doubt, start small, prove it with evidence, and let the signals drive fixes on the front lines where users live.
Your site returns 200 OK — but is it actually working?
Guard is the monitoring technology that catches the silent failures other tools miss. KeyPages.ai is where you turn it on. Audit any URL free first — no signup, results in 30 seconds.
Run a free page audit