Synthetic Monitoring for Websites: A Practical Guide to Critical User Flows
A practical, no-fluff guide to synthetic website monitoring. Learn how automated checks simulate users, choose key flows, set meaningful assertions, capture evidence, and confirm recovery without building sprawling end-to-end tests.
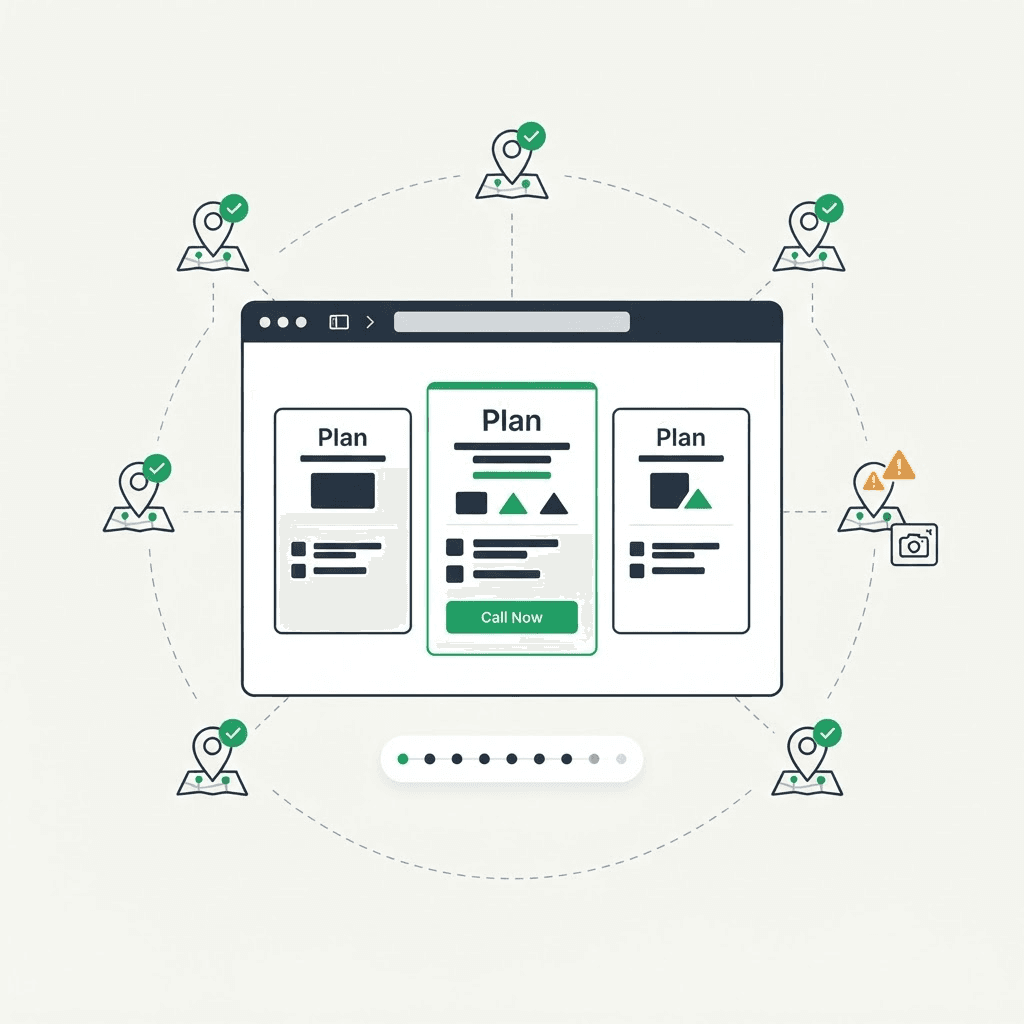
Synthetic monitoring checks core user experiences from the outside in. It runs automated checks on a schedule, from locations you care about, to verify critical pages and flows. The goal is to surface silent regressions, not to exhaustively test. Examples: a page renders with 200 OK but empty body, a missing CTA after a deploy, a script error in the browser, or a checkout flow that redirect-loops. In modern web apps, user perception matters as much as uptime. Synthetic monitoring acts as a proactive, browser-level health check that complements telemetry, not replaces it.
What is synthetic monitoring and how it works
Synthetic monitoring automates simulated user activity. Instead of waiting for real users, you configure tests that act like a browser: navigate to a URL, wait for load, click, fill, submit, or validate content. Checks run on a schedule from multiple locations. They exercise the browser rendering path, revealing issues backend checks miss: JavaScript errors, missing DOM elements, SPA hydration failures, or CSS layout problems. Practical checks are shallow by design: cover representative, high-value flows rather than entire journeys. Think of them as smoke tests for user-facing pages, not a full QA suite.
Where synthetic monitoring fits in the monitoring stack
Your website observability stack has layers with different purposes. Synthetic monitoring sits beside uptime, real-user monitoring (RUM), logs, and automated testing. How they fit together:
- Uptime: Checks basic availability and 200 responses. A baseline health signal. But 200 OK can mask browser render failures.
- Synthetic monitoring: Verifies critical user paths from the browser, catching issues in HTML, CSS, and JavaScript execution. It targets customer-facing reliability, not just server uptime.
- Real-user monitoring (RUM): Gathers data from real visitors on performance, errors, and engagement. Produces production signals synthetic checks might miss if coverage is uneven.
- Application logs: Deep server and backend insight. Essential for diagnosing server errors, API failures, or business-logic problems.
- Automated testing: End-to-end tests in CI/pre-production. They catch regressions before release but can be brittle. Synthetic checks are lightweight, fast, and user-facing.
Used together, you get a robust view: uptime for baseline availability, synthetic checks for critical flows, RUM for real experiences, logs for root cause, and automated tests for new features. Balance: choose a few high-value flows and maintain a small, sustainable surface area. For a deeper comparison of the first two layers, see real browser monitoring vs uptime monitoring.
Targeted flows that matter: practical examples
Focus on 3–5 user-side flows per surface area that impact revenue, retention, or trust. Here are concrete examples with possible assertions:
- Loading a pricing page: Visit /pricing, render check, pricing cards present, key CTAs visible and enabled. Verify price text matches canonical data and no "price unavailable" banners appear.
- Starting signup: Go to /signup or /register, render form with required fields, primary CTA visible. Validate initial validation messages appear only after interaction.
- Performing a search: Load home or search page, type a keyword, verify results load within latency budget, results contain expected items. Check default sort, working filters, and that clicking a result goes to a detail page.
- Reaching checkout: Add a product to cart and open checkout entry. Validate cart contents render, subtotal matches, taxes/shipping display, and the checkout CTA is accessible. Promo code fields, if optional, should not break the page.
- Verifying a client portal login: Load login, submit valid credentials, verify redirect to the dashboard. Check session cookies, user-specific content, and a logout option. If 2FA exists, validate the 2FA prompt renders, but don't complete it in a single run.
- A generic content render: Test a key marketing or help page. Assert essential elements render (title, H1, CTAs, hero), with no missing content or broken assets. Catches deployments that remove content or mis-tag meta data.
Group these into a small set of high-value flows per surface area (pricing, signup, search, checkout, portal). Test core journeys and healthy renders at each step. If you need help deciding which pages earn a slot, this guide to monitoring pages beyond the homepage walks through the prioritization.
Assertions, evidence, and recovery validation
The value comes from precise assertions and solid evidence when things fail. A shallow assertion set is fast but can miss real failures. A brittle script wastes time. Use stable selectors, tolerant expectations, and environment-aware checks. Patterns:
- Solid selectors: Prefer stable attributes (data-qa, aria-label, role) over brittle text. If you rely on text, allow for minor copy changes.
- Meaningful assertions: Validate critical content (title, H1, CTA), key metrics (price, currency, count), and absence of unexpected errors. Ensure promo codes don't force an error unless intended.
- Performance budgets: Record load time, time-to-interactive, and render-start. Flag pages that cross thresholds, even if content loads.
- Evidence capture: On failure, capture screenshot, HTML snapshot, final URL, page title, H1, canonical, robots meta, visible text length, DOM hints, console errors, and loaded resources (scripts, fonts, images). For login or payments, include relevant script signals and error messages.
- Recovery checks: After a failure, re-run to confirm recovery. Don't rely on a single pass. If the first attempt fails due to network hiccups, retry and report persistent failures clearly.
Craft assertions per flow. For pricing, ensure the main price element exists and CTA is enabled. For signup, verify the form renders without error banners. For portal login, confirm dashboard title appears and a logout control is visible.
Practical workflow: choosing flows, asserting wisely, and building resilience
Keep synthetic monitoring practical with a repeatable workflow. A lightweight, production-friendly recipe:
- Define value-critical flows: Pick 3–5 flows per domain that impact revenue or trust (e.g., Pricing, Product/Search, Add to Cart, Checkout Entry, Login). For SaaS or portfolios, include Pricing/Plans, Sign-up, Search, Portal Login, Help.
- Map expected outcomes: List exact signals for each flow (pricing: plan cards with prices; signup: form presence; search: results; checkout: cart and CTA; login: redirected dashboard).
- Build resilient selectors: Use stable attributes. If relying on text, anchor to a known substring or the first h1 under main content.
- Timeouts and budgets: Target fast pages (e.g., under 3 seconds TTI). Fail fast with evidence if a test can't complete.
- Evidence capture: Always collect a screenshot, full HTML, final URL, title, H1, and a concise set of console messages. Include a DOM/hash snapshot when relevant.
- Validate recovery: Re-run after failure to prove persistence or transience. Escalate if failures repeat within a short window.
- Schedule and locations: Run from locations that reflect your user base. A few well-chosen regions beat generic checks.
- Alerts and runbooks: Set thresholds that avoid alert storms. Pair each alert with a runbook: what changed, what to inspect, and which evidence to review.
- Review and prune: Regularly prune drifted flows. Quarterly cleanup keeps noise down.
These steps keep a focused, resilient program. Synthetic checks don't replace QA automation; they provide a real-time, browser-visible health picture for critical journeys.
Your site returns 200 OK — but is it actually working?
Guard is the monitoring technology that catches the silent failures other tools miss. KeyPages.ai is where you turn it on. Audit any URL free first — no signup, results in 30 seconds.
Run a free page auditCommon pitfalls and how to avoid them
Synthetic monitoring is simple in concept but easy to misuse. Avoid these patterns:
- Broad, brittle checks: Test too much and maintenance explodes. Start small and expand only when it adds coverage without breaking.
- Over-reliance on UI strings: Text changes happen often. Prefer structural signals (CSS classes, IDs, data attributes) and treat text changes as a separate signal.
- Missing recovery verification: A pass after reload isn't proof of health. Re-run and confirm stable render and content before declaring healthy.
- Overlooking dynamic content: Many pages load content asynchronously. Wait for essential elements or network requests, but use reasonable timeouts.
- No visibility into script health: A 200 with a broken script hurts users. Capture browser errors, missing assets, and hydration issues.
- Inadequate evidence: Failures should come with a consistent evidence bundle for quick diagnosis.
- Flaky at scale: Network jitter causes false positives. Use short retries and track flakiness separately.
A practical plan accepts some tradeoffs: shallow, stable checks that surface regressions reliably beat deep, brittle scripts that break often. Measure the right things, in the right places, with quick-to-review evidence.
Putting it into practice: a compact runbook and sample checklist
Use this runbook to stand up a practical synthetic baseline focused on critical flows:
- Step 1: Inventory critical pages and journeys. List 3–5 high-value flows and the exact pages (e.g., Pricing, Sign-up, Search results, Checkout entry, Portal login).
- Step 2: Define baseline expectations. Specify required elements, expected text, and minimum success criteria (e.g., CTA visible, price present, results loaded).
- Step 3: Create browser checks with resilient selectors. Prefer data attributes and sanity checks tolerant of minor copy changes.
- Step 4: Add evidence capture. Ensure every check stores a screenshot, HTML snapshot, final URL, title, H1, canonical, and console messages.
- Step 5: Implement recovery tests. After any failure, re-run the flow to confirm recovery.
- Step 6: Schedule multi-location runs. Use a representative mix of regions and browsers.
- Step 7: Configure alarms and runbooks. Tie alerts to symptoms and point responders to evidence.
- Step 8: Review quarterly. Prune drifting flows, refine selectors, retire brittle checks.
Checklist:
- Flow: Pricing page
- Assertions: All plan prices visible; CTA enabled; no error banners
- Evidence: Screenshot, HTML snapshot, final URL chain, title, H1, canonical, console errors
- Recovery: Re-run after failures; verify re-render with expected content
- Location coverage: 3 regions, 2 browsers
- Flow: Sign-up
- Assertions: Form fields present; primary CTA visible; initial validation state OK
- Evidence: Cookies, session indicators, screenshot, DOM snapshot
- Recovery: Retry once; ensure sign-up path succeeds
- Location coverage: 2 regions, 1 mobile/desktop mix
- Flow: Checkout entry
- Assertions: Cart contents match; subtotal shown; checkout CTA present
- Evidence: Final URL, DOM state, console messages, resource list
- Recovery: Validate after retry
- Flow: Portal login
- Assertions: Redirect to dashboard; dashboard title visible; logout present
- Evidence: Redirect URL, user-specific checks, session cookie
- Recovery: Validate after token refresh if applicable
Keep scope tight to reduce maintenance. As you scale, add a fifth flow per area or lightweight canaries for new deployments.
DataJelly Guard and synthetic monitoring nuance
DataJelly Guard complements synthetic monitoring by capturing browser-rendered evidence that helps diagnose what users see. It's optional but valuable when you need to confirm recovery after a failure. Guard focuses on evidence you can review quickly: screenshots, rendered HTML, final URL and redirects, title/H1/canonical/robots, visible text metrics, DOM/hash signals, console and resource errors, and flow-specific signals. The full list of what each run records is in the Guard test suite details. If you already run synthetic checks, Guard adds a reliable evidence layer that speeds triage and reduces MTTR. It's especially useful on flows where silent regressions cost conversions or erode trust: pricing, signup, login, and checkout entry are prime examples.
Note: Guard provides evidence capture and quick confirmation, not a cure-all. Use it with uptime, RUM, logs, and testing to triage incidents. When you use Guard, pair it with production monitoring and a clear retention policy for browser-rendered signals to support postmortems and audits without overwhelming your pipeline.
Putting it all together: a practical blueprint for your site
If you're standing up synthetic monitoring from scratch, follow this blueprint in the next sprint:
- Phase 1: Baseline survey. Identify 3–5 flows per domain (e.g., pricing, signup, search, checkout entry, login). Document pages and minimal healthy signals. Collect baseline latency, render times, and error counts.
- Phase 2: Build resilient checks. Implement browser tests with stable selectors, robust assertions, and timeouts. Ensure each check captures a standardized evidence bundle on failure.
- Phase 3: Multi-location rollout. Run from several regions and two browsers. Start with a cadence of every 5–10 minutes and scale as confidence grows.
- Phase 4: Alerting and runbooks. Set alerts for regressions with a one-page runbook detailing what to inspect and which evidence to review.
- Phase 5: Evidence review cadence. Weekly failure reviews and quarterly pruning of drifting or brittle flows.
- Phase 6: Optional enrichment. If you have DataJelly Guard, enable browser-rendered evidence for the most critical flows and weave it into incident response and postmortems.
By the end of Phase 1–3, you'll have a lean, defendable synthetic surface that catches silent regressions before revenue is affected. Phase 4 accelerates response; Phase 5 keeps the system healthy over time.
Start with 3–5 high-value flows, solid assertions, and reliable evidence
Start with 3–5 high-value flows, solid assertions, and reliable evidence. Build a lightweight synthetic monitoring baseline that proves user-facing health, then scale thoughtfully, with Guard providing browser-rendered insights when you need them. If you want a quick look at what a single rendered check surfaces on one of your own pages, run the free Guard page audit.
Further reading
Your site returns 200 OK — but is it actually working?
Guard is the monitoring technology that catches the silent failures other tools miss. KeyPages.ai is where you turn it on. Audit any URL free first — no signup, results in 30 seconds.
Run a free page audit